The applications for post-consumer recycled, high-density polyethylene (HDPE) has been increasing steadily in recent years. As per the report published by the Association of Post-Consumer Plastic Recyclers, around 974,000,000 pounds of HDPE was recycled in 2011.
Recycled HDPE is a cost-effective, environment friendly alternative to virgin HDPE and has become an important raw material for the manufacture of many HDPE-based products like decking material, sheet, electrical conduit, bottles, etc.
A majority of the recycled HDPE is from bottles, most of which have pour spouts and caps made of polypropylene (PP) – a material with properties similar to HDPE. However, PP is a common contaminate found in post-consumer recycled HDPE resin, which tends to have adverse effect on the performance of the end-product.
For a high quality product it is necessary that operators observe and control the quantity of PP contained in the recycled resin. Fourier Transform Infrared Spectroscopy (FT-IR) is a useful tool in monitoring the PP levels. The PerkinElmer Spectrum Two™ FT-IR is an accurate, easy-to-use system for the measurement of the quantity of PP in the recycled HDPE resin. This article describes the methodology followed for using the PerkinElmer Spectrum Two for such analyses.
Experimental Setup
The standards that are prepared by Advanced Blending Technologies are shown in Table 1. The first step was dry-blending of virgin HDPE samples with virgin homopolymer PP pellets based on the percentages shown in Table 1. A range of 3-12% was covered, which is the typical range of PP level in recycled HDPE resin.
The second step was the hot melt compounding and extrusion through a ¾ -inch single screw laboratory extruder. For a homogenous blend of the sample the dry blend and re-extrusion steps were performed two additional times, adding up to a total of three passes through the extruder.
Table 1. Standards at Four Different Blends of polyethylene and polypropylene
| Name |
Polypropylene (%) |
Polyethylene (%) |
| 12% PP 4 |
12 |
88 |
| 9% PP 4 |
9 |
91 |
| 6% PP 4 |
6 |
94 |
| 3% PP 4 |
3 |
97 |
The spectra of the standards at a spectral resolution of 4cm-1 for four co-adds were collected using the PerkinElmer Spectrum Two coupled to a diamond single-bounce ATR. The HDPE/PP resin pellets were positioned/pressed on the diamond crystal for direct measurement without any sample preparation.
Each standard was tested 5-6 times using different pellets. A calibration method was built using the PerkinElmer Spectrum Quant software based on the data derived for the standards.
Spectrum Quant is a versatile software package, which uses the linear regression-based Beer’s Law, that permits the use of area, peak or maximum peak, peak ratio and area with baseline options. Besides these features, the software provides options for cubic and quadratic curve fitting.
In this analysis the PE peak centred at 719cm-1, which is attributed to the methylene group rocking, is ratioed against the PP peak centred at 1,376 cm-1, which is associated with symmetrical bending of the methyl group. The corresponding spectra are shown in Figure 1 and the peak ratios based on which the calibration curve is developed are shown in Figure 2.
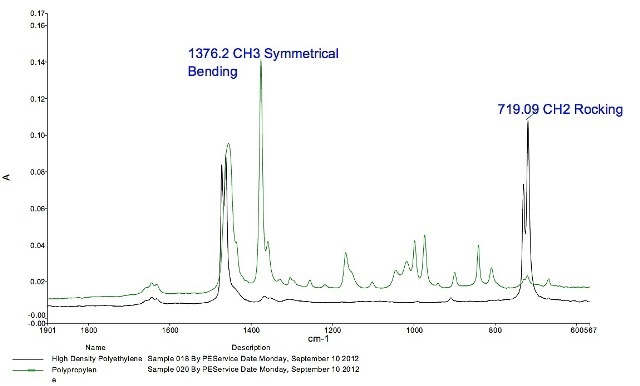
Figure 1. Spectral Comparison of High Density Polyethylene and Polypropylene
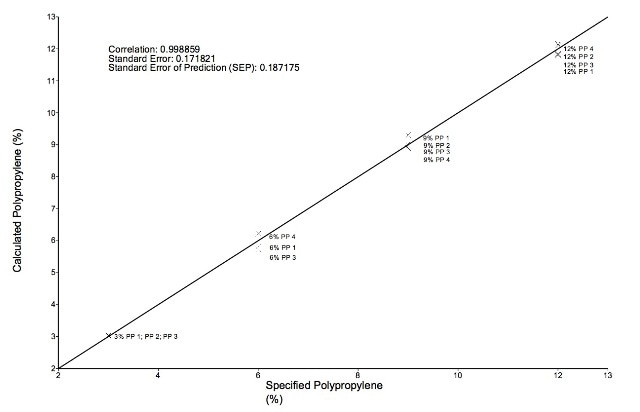
Figure 2. Calibration Model for PP
Experimental Results
Figure 2 demonstrates a good linear fit for the value of PP calculated based on the peak ratio and the specified values, with a regression correlation of approximately 0.999. The model is considered robust due to low values of standard error of prediction (SEP) which is approximately 0.19%.
Validating the model is a critical step in any quantitative analysis. In this analysis the Spectrum Quant Software is used for independent validation, with the validation results for PP shown in Table 2. The residual values are typically low, which is in line with the good linear fit shown in the calibration curve.
Table 2. Validation results for PP
| Validation Samples Specified |
|
Calculated |
Residual |
| 12% PP validation |
12 |
11.7817 |
0.218282 |
| 9% PP validation |
9 |
9.30215 |
-0.302153 |
| 6% PP validation 1 |
6 |
5.60739 |
0.392614 |
| 6% PP validation 2 |
6 |
5.70573 |
0.294273 |
| 3% PP validation |
3 |
3.17936 |
-0.179363 |
Conclusion
The PerkinElmer Spectrum Two in combination with a single-bounce ATR accessory provides high quality spectra that can be recorded within seconds without the need for sample preparation. The operation of the equipment is easy due to its advanced design and built-in algorithms.
The experimental setup provided results within a few minutes. In this analysis preparation of the ‘contaminated’ resin standards was an elaborate process that required a lot of time.
In conclusion, the calibration curve showed excellent linearity and robustness, indicating that, for the levels of PP in recycled HDPE measured here, the Spectrum Two
is an excellent tool for quick screening analysis. It is noted that, for higher concentrations, a second calibration might be required, bracketing the higher concentrations of PP in recycled HDPE resin.

This information has been sourced, reviewed and adapted from materials provided by PerkinElmer.
For more information on this source, please visit PerkinElmer.