Process Insights’ MAX 50™ flange mounted quadrupole mass spectrometer and VeraSpec™ HRQ turnkey system integrates a 19 mm tri-filter quadrupole and 2.9 MHz Quadrupole Power Supply (QPS) to offer users the tools to deliver rapid, sensitive and consistent analysis. Accomplishing this level of performance using quadrupole mass spectrometry is an effective form of high-resolution analysis.
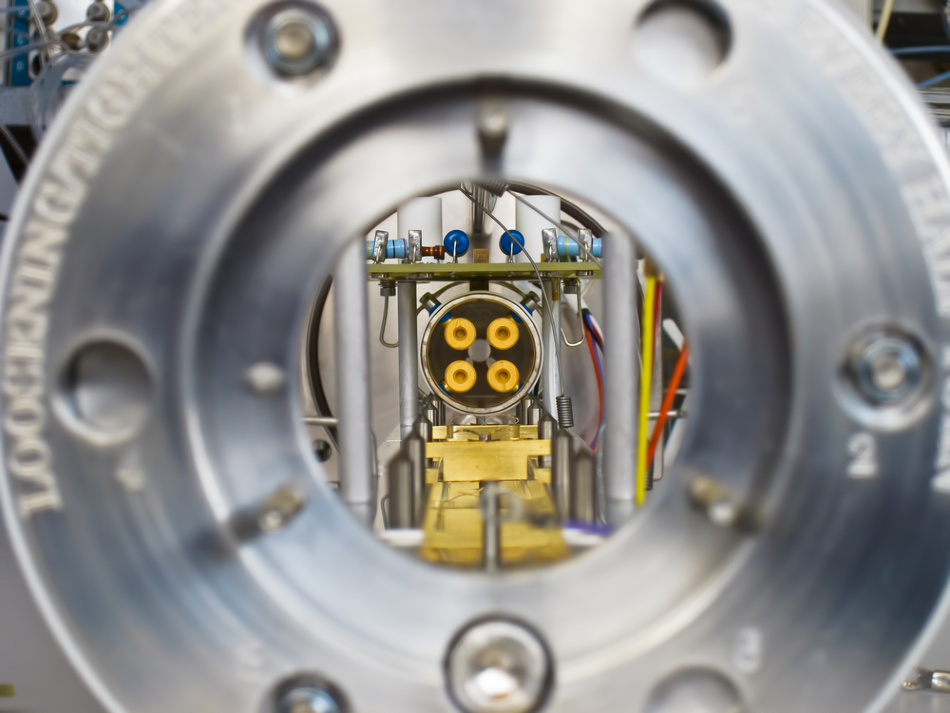
Image Credit: Shutterstock/Jens Goepfert
Product Advantages:
- High resolution >4000 (M/ΔM–FWHM)
- High resolution can be realized while scanning the whole mass range
- Variable resolution
- User selectable resolution across whole (50 amu) mass range
- Excellent high-resolution mass stability
- High-abundance sensitivity
- Fast, high-resolution scans
- Up to 5000 data points per amu in scans
- Low detection limits
- Approximately 10 ppm under high-resolution conditions

Figure 1. VeraSpec HRQ High Resolution Quadrupole Mass Spectrometer.
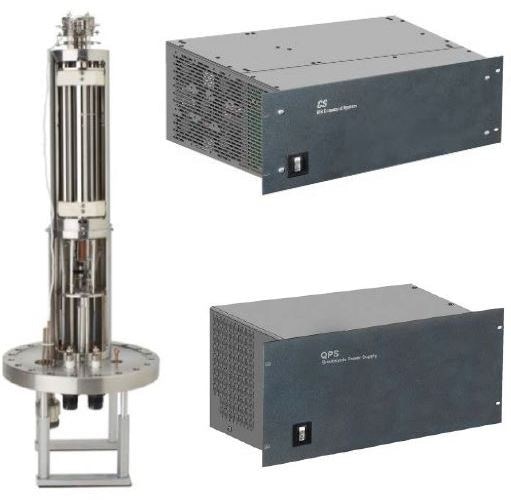
Figure 2. MAX 50 Flange Mounted Quadrupole Probe and Control System.
High Resolution
The resolution capabilities are >4000 (M/ΔM–FWHM), measured with Argon at m/z 40. This permits the separation of species such as helium and deuterium, 4.002 and 4.028 amu, respectively. Figure 3 presents an example spectrum. This spectrum was collected with the help of a scan speed of almost 1-second per scan.
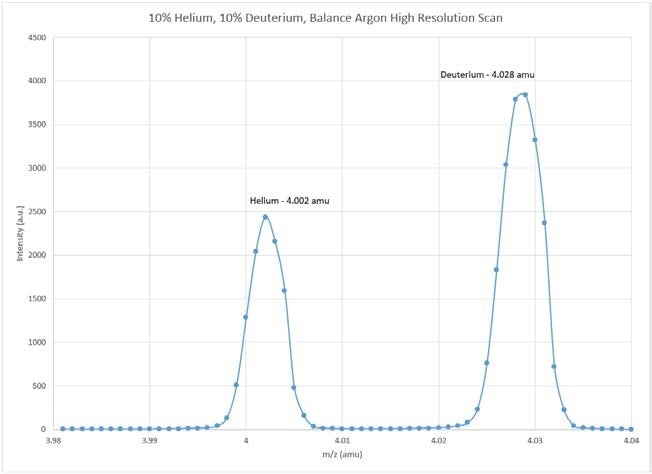
Figure 3. 3.98–4.04 amu Scan of 10% Helium, 10% Deuterium, Balance Argon
Variable Resolution—User Selected over Entire Mass Range
Typical use of a quadrupole mass spectrometer needs a nominal resolution setting at 1 amu across the mass range, or unit-mass resolution. Process Insights system hardware is calibrated and set in the factory in order to develop spectra with unit-mass resolution for all masses in range with zero (or near zero) software adjustments. Calibration points, or software adjustments, can be added anywhere in the table within the mass range. This enables the user to effortlessly adjust the settings to fit the requirements of their experiment.
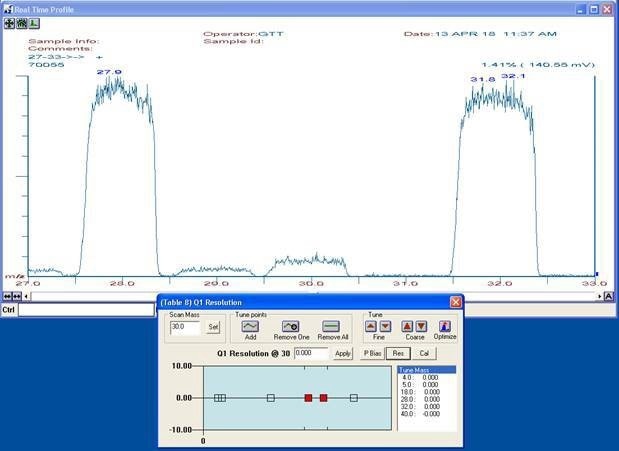
Figure 4. Resolution Calibration Table.
Resolution points at m/z 4, 5, 18, 28, 32, and 40 were further added to the table and set to 0.0. When the resolution at m/z 28 is altered, the resolution of the peaks between m/z 28 and the adjacent calibration point will get affected. The relative adjustment is demonstrated in the resolution calibration table and the changed resolution of m/z 28 and m/z 29 is displayed in Figure 5.
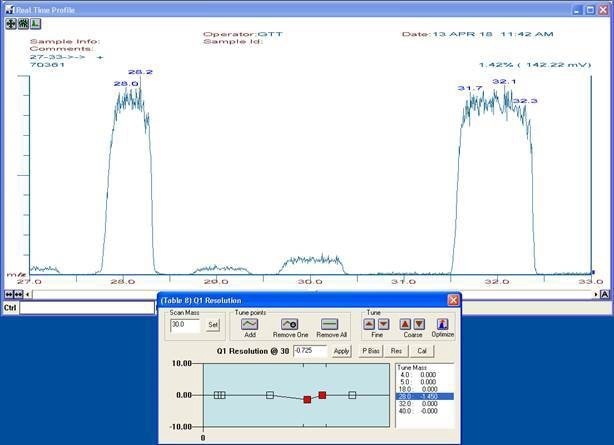
Figure 5. Resolution Calibration—Adjusted Table.
Entire scans under high-resolution conditions, or entire scans with unit-mass resolution, can be run if specified points are not added to the table. The addition of many points to the table produces multiple regions, each with varied resolution settings across the scan.
An instance of a complete, 1-50 amu, scan with different resolution is illustrated in Figure 6. The spectrum was recorded with the help of a two-second scan, high-resolution settings from m/z 3.9-4.1 amu, and nominal resolution elsewhere.
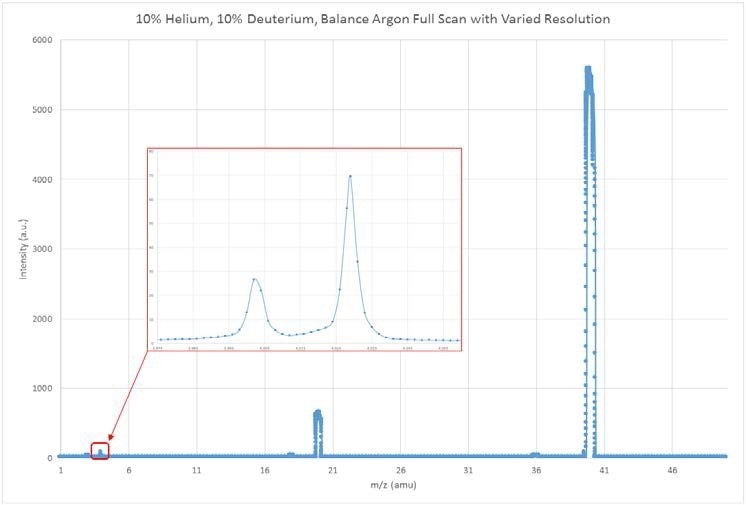
Figure 6. A mass spectrum of 1-50 amu showing a variable resolution. Sample consists of 10% helium, 10% deuterium, and balanced argon.
High Abundance Sensitivity
Abundance sensitivity is considered to be an accurate value representing the efficiency of how the mass spectrometer can measure adjacent peaks. This is vital for applications dealing with neighboring spectral signals with significantly different concentrations. The exceptional abundance sensitivity is shown in Figures 7 and 8.
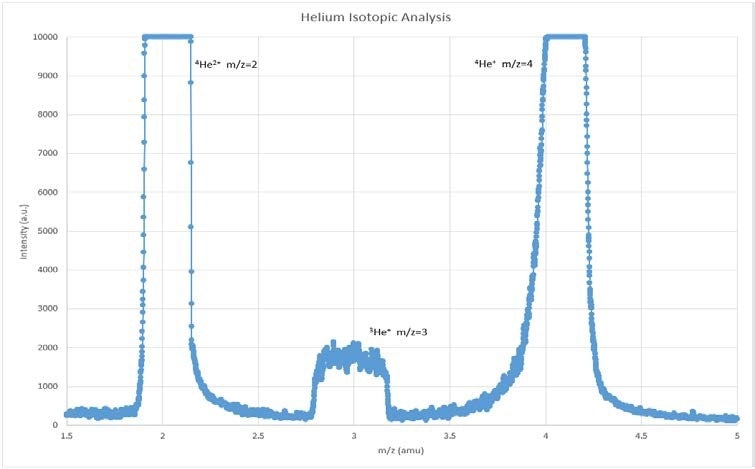
Figure 7. UHP helium scan for analysis of 3 He Isotope (1.4 ppm Relative Abundance). The Resolution Was Set Appropriately for the Isotopic Analysis (Less than the maximum resolution for the scan).
High-resolution scan conditions are used for observing this abundance sensitivity. In an analysis of helium and deuterium at changing relative concentrations, a high abundance sensitivity eradicates any spectral interference between the two species. In Figure 8, the special overlay shows four such scans. The scans were collected using the following:
- UHP helium (saturating the detector)
- UHP helium when added to the system (before saturating the detector)
- UHP helium mixed almost 50/50 with a helium/deuterium cylinder (10% helium, 10% deuterium, balance argon)
- 10% helium, 10% deuterium, balance argon cylinder alone
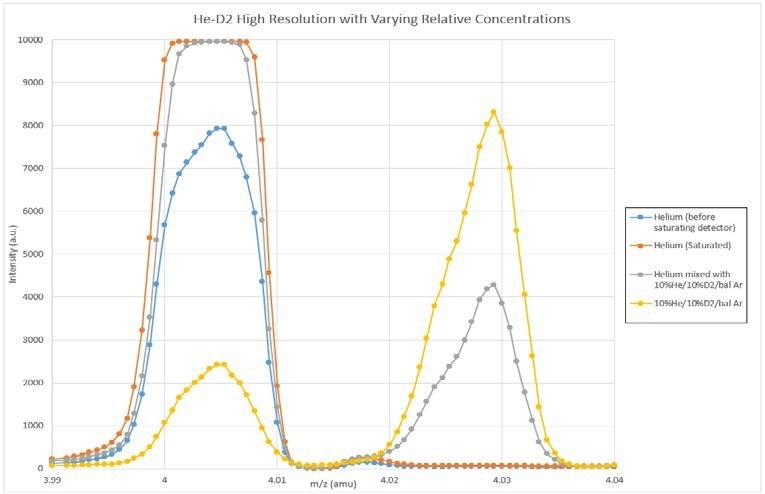
Figure 8. High-resolution scans of varying relative concentrations of helium and deuterium collected using a one-second scan time, with 1500 Points/amu.
Fast High Resolution Scans
Exceptional spectra are delivered without too much averaging and scan times. For experiments that need many data points in every single scan, it is able to gather up to 5000 data points/amu.
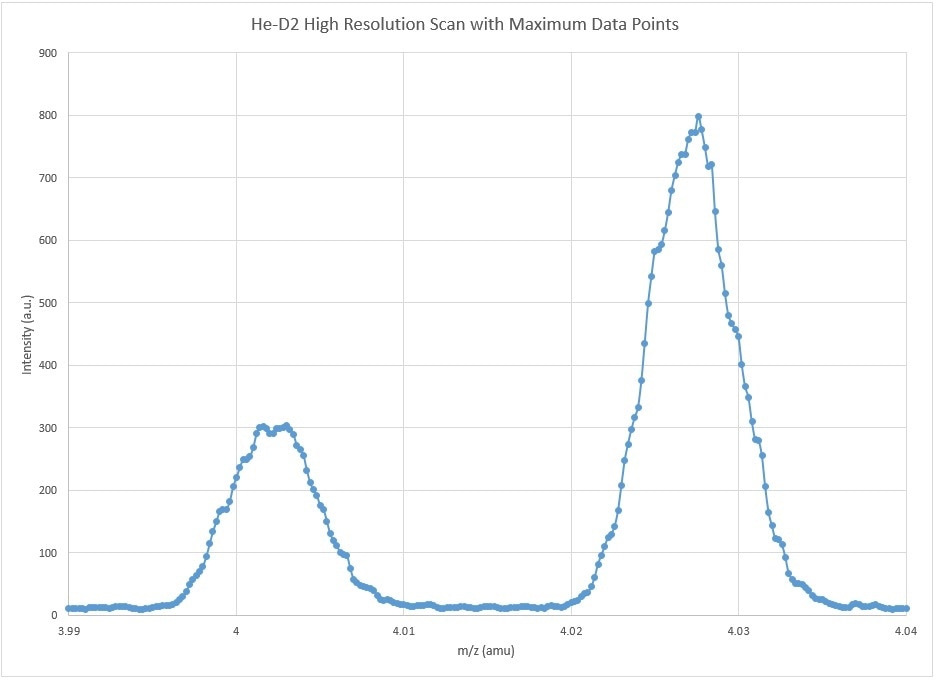
Figure 9. High-resolution scan of helium and deuterium with maximum data points (points/amu) collected using one-second scan with the maximum amount of points/amu. The scan range of m/z 3.99–4.04 Resulted in 250 data points.
High-Resolution Mass Stability
Long-standing stability of a system is vital for extended analyses or experiments, and to prevent excessive time checking and recalibrating mass position. Stability becomes progressively more visible and important under high-resolution conditions. To monitor the stability, a cylinder of 10% helium, 10% deuterium, balance argon was connected and examined for 24 hours. Spectra at six-hour time intervals, starting at t=0, were used to evaluate the stability of the instrument. Spectra were collected using a 1 second scan with 5000 points/amu. A spectral overlay of the results found is shown in Figure 10. The experiment demonstrated practically no detectable mass spectral changes over a period of 24 hours.
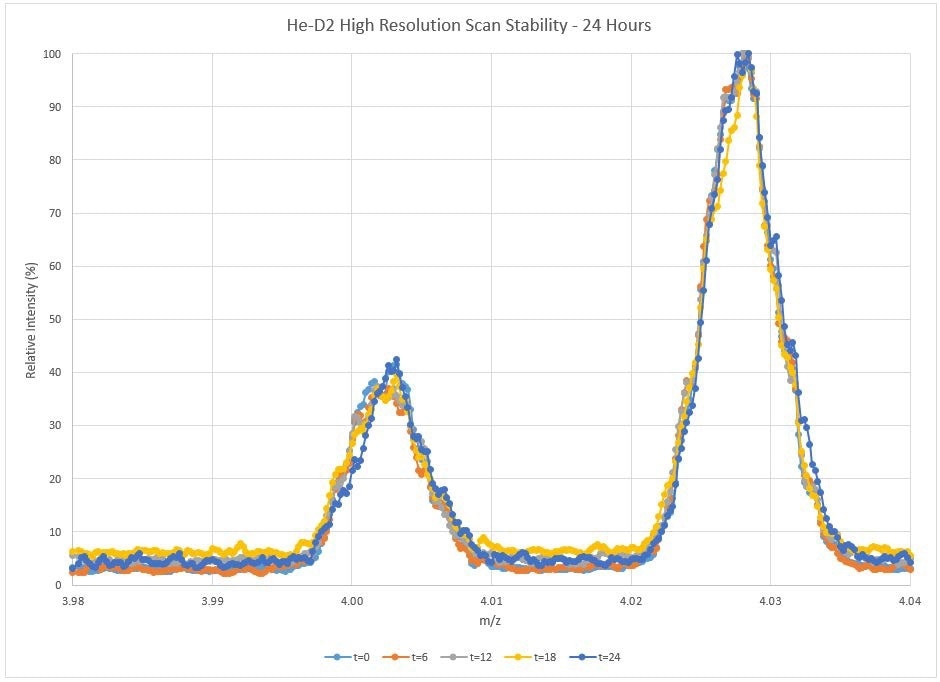
Figure 10. Spectral overlay of high-resolution scans during 24 hour stability experiment.
Low Detection Limits
The resolution setting influences detection limits of a system. A sample dilution was used to experimentally determine low detection limits at high resolution. A cylinder of 10% helium, 10% deuterium, balance argon was diluted with UHP argon with the help of two mass flow controllers. Almost 50 cc/minute of dilution gas was used while the flow of sample was set to 8, 6, 4, 2, and 0 cc/minute. This data was used to produce a dilution curve and then calculate the low detection limits for both species. Tabulated detection limit results for helium and deuterium are presented in Figures 11 and 12 respectively, and the dilution curve in Figure 13.
| m/z 4.002 10% He / 50 sccm Ar |
| Concentration |
0.00% |
0.42% |
0.87% |
1.36% |
1.90% |
| Average |
7.52 |
1509 |
3018 |
4551 |
6141 |
| Standard Dev |
1.65 |
18 |
27 |
30 |
40 |
| RSD |
22% |
1.2% |
0.9% |
0.7% |
0.7% |
| Sig / PPM |
|
333250 |
|
|
|
| LDL(PPM) |
|
14.9 |
|
|
|
Figure 11. Low detection limit calculation for helium.
| m/z 4.028 10% D2 / 50 sccm Ar |
| Concentration |
0.00% |
0.42% |
0.87% |
1.36% |
1.90% |
| Average |
9.02 |
2626 |
5163 |
7397 |
9079 |
| Standard Dev |
1.91 |
25 |
50 |
44 |
105 |
| RSD |
21% |
1% |
1.0% |
0.6% |
1.2% |
| Sig / PPM |
|
560116 |
|
|
|
| LDL(PPM) |
|
10.2 |
|
|
|
Figure 12. Low detection limit calculation for deuterium.
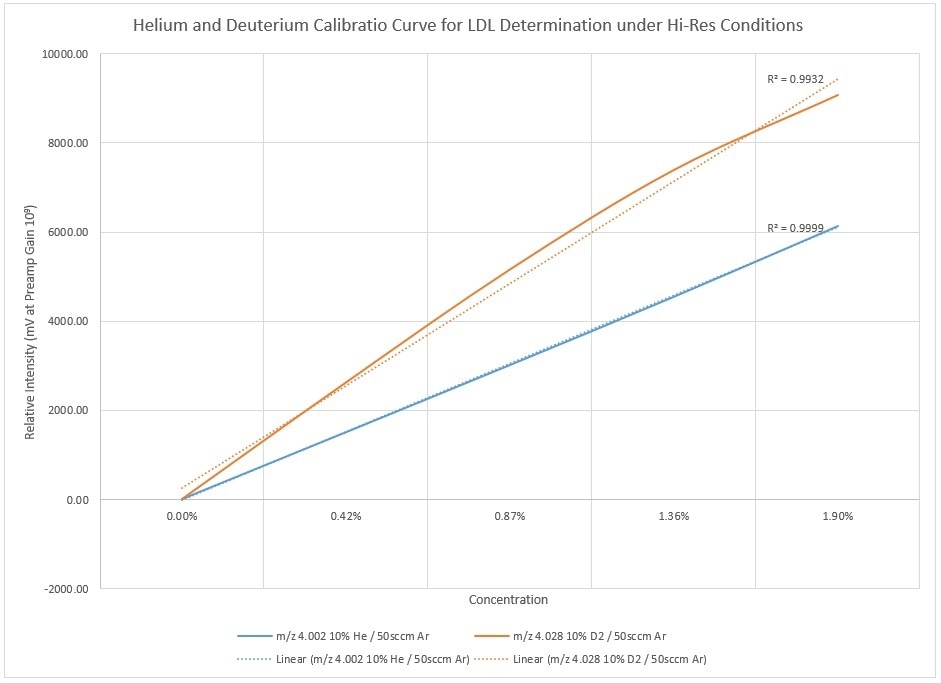
Figure 13. Dilution curve from helium-deuterium detection limit experiment.

This information has been sourced, reviewed and adapted from materials provided by Process Insights - Mass Spectrometry.
For more information on this source, please visit Process Insights – Mass Spectrometers.