Using Renishaw’s Correlate module, it is now possible to correlate the highly specific chemical information shown in Raman images with complementary results from other imaging techniques.
The Correlate module means that it is possible to analyze the same sample positions in multiple microscopy systems and then overlay the resulting images.
The Correlate module is available in Renishaw’s WiRETM Raman spectroscopy software, and includes the following integrated tools:
- Batch Measurements to automate Raman data collection at multiple positions
- Coordinate Manager to import and transform coordinates between different systems (e.g., a scanning electron microscope (SEM) and an inViaTM confocal Raman microscope)
Correlated Raman and SEM analyses were performed on a mineralogical section containing a dissolution layer in mineralized limestone. This layer was analyzed to provide information on residual mineral species to help understand ore nucleation processes.
SEM Images
The backscattered electron (BSE) SEM images provide information on the atomic number of the elements in the sample. The element is heavier where the image is brighter.
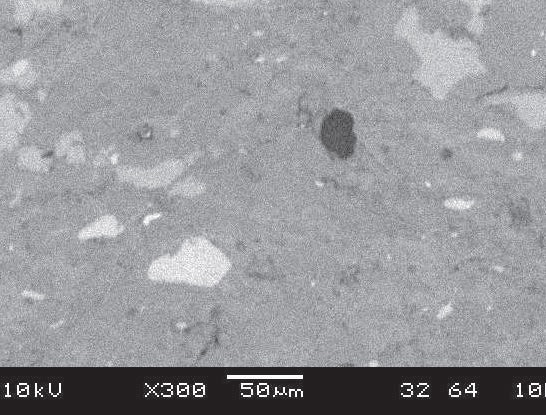
Figure 1. SEM image of geological sample.
Raman Images
Raman images show structural and chemical information on each mineral – where the image is colored, a specific compound or component is present. The minerals identified in the Raman images were anatase, rutile, apatite, brookite, quartz, calcite, and amorphous carbon.
The Raman images show the additional chemical specificity clearly (e.g., titanium dioxide polymorphs). Many images that are not visible in the SEM can be clearly identified in the Raman image.
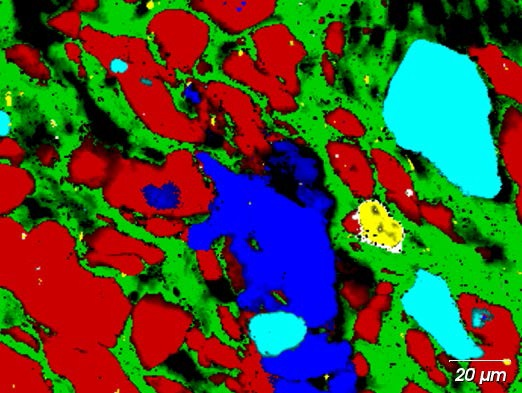
Figure 2. Raman image of a geological sample.
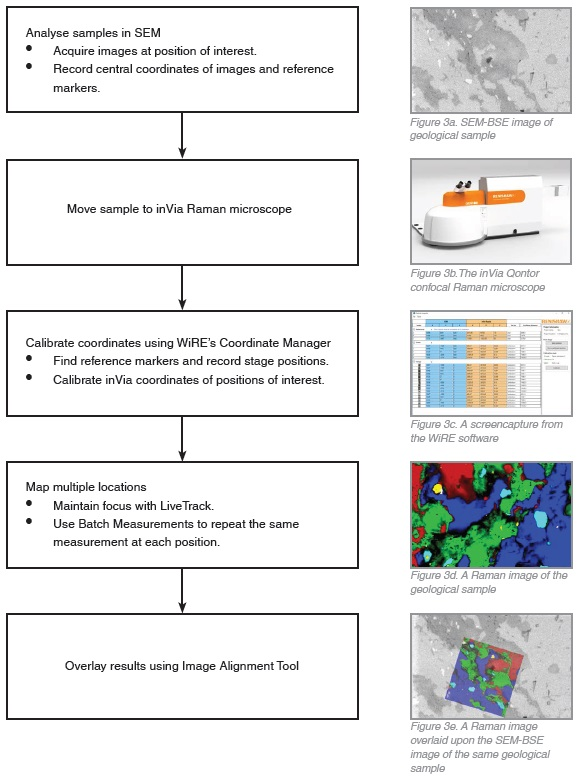
Acquiring the SEM and Raman Data
SEM images of four positions on the mineralogical sample were acquired initially using a BSE (JEOL JSM 6060 LV). This revealed differences in elemental atomic numbers composition over the areas analyzed. Then, the sample was moved to an inVia Qontor confocal Raman microscope for Raman analysis.
The Coordinate Manager was used to transform coordinates and to allow for analysis at the same four positions. To run the same measurement centered at each position, the Batch Measurement capability in the WiRE software was used, with LiveTrackTM maintaining focus throughout the process.
The Image Alignment Tool was used to generate and overlay Raman images of the identified minerals. In order to accurately overlay the Raman images on the SEM images, the rotation and scale of the images were pre-adjusted from the transformed coordinates. Below is a summary of the experimental workflow.
Overlaying SEM and Raman Images
Using the SEM and inVia, four positions were analyzed. Figure 4 shows individual and overlaid SEM and Raman images. The context of these images relative to the larger structure of the sample is seen in Figure 5.
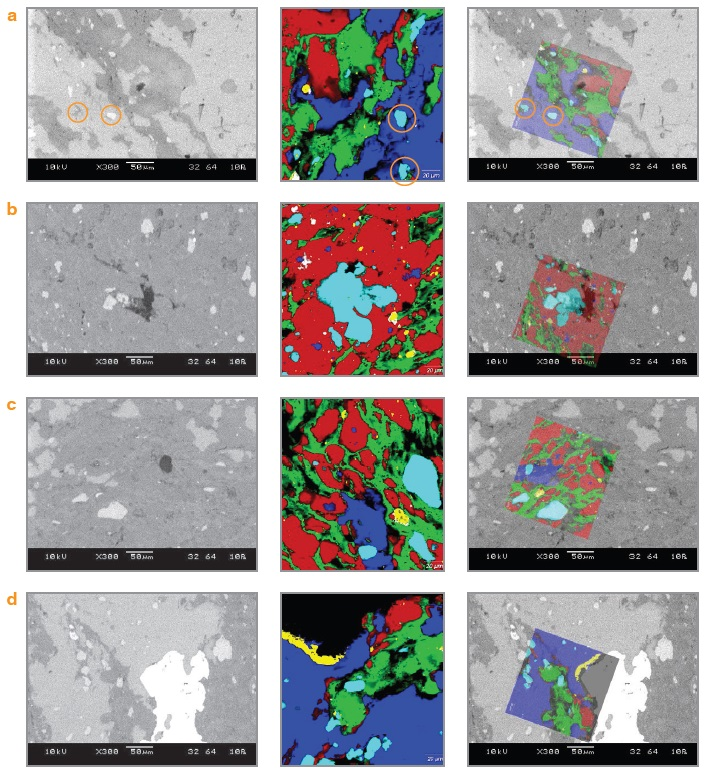
Figure 4. (L to R) SEM-BSE, Raman, and overlaid SEM and Raman images acquired at four positions (a to d) on the geological sample. The colours in the Raman images correspond to the identified components: rutile (yellow), anatase (white), apatite (light blue), carbon (green), quartz (red) and calcite (dark blue).
Correlating Images
The combined information from the Raman, SEM, and white light images show:
- Generally, bright areas in the SEM image correlate with apatite, anatase, and rutile, which contain heavier elements than the other identified minerals. The darker areas in the SEM images correlate with carbon and quartz, which are composed of lighter elements.
- The Raman image in Figure 4(a) shows clear domains of apatite, a calcium phosphate mineral. Subtle changes in the Raman spectra from these two domains can be seen, as well as the brightness change seen within the SEM image. The correlation between the two techniques has demonstrated apatites of a different elemental composition. Where the apatite appears darker in the SEM image, it may be composed of heavier elements (different end-member ratios).
- The SEM image in Figure 4(c) shows a significant area of grey, featureless material. However, in the Raman image, detailed distribution of carbon and quartz is revealed.
- In many areas of the SEM image, no contrast is seen. When viewing the overlaid Raman image, it becomes clear that many of these areas contain a wide assembly of minerals.
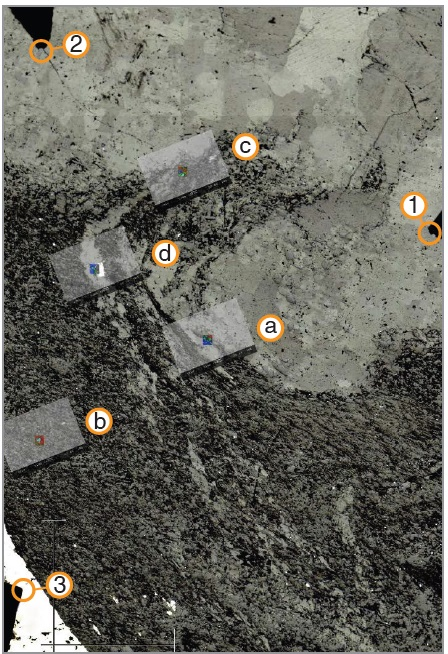
Figure 5. While optical microscope images are not required to use the features of the Correlate module, this inVia white light montage of the dissolution layer in the mineral section was generated and, by matching the microscope’s coordinate systems with the Correlate module, overlaid with SEM and Raman images (seen in Figure 4) of each analysed position (a – d). Specific points on the reference makers (1 – 3) were used to transform coordinates between the SEM and the inVia system at a high precision.
Conclusion
Renishaw’s Correlate module has correlated SEM, white light, and Raman images to provide a detailed insight into the structure and composition of a dissolution layer in mineralized limestone. This detailed insight can aid in the understanding of ore nucleation processes in mineral deposits where dissolution is present.
Acknowledgments
Thanks to Dr. Richard Unitt at University College Cork for providing the sample and helping with the interpretation of the results.

This information has been sourced, reviewed and adapted from materials provided by Renishaw plc - Spectroscopy.
For more information on this source, please visit Renishaw plc - Spectroscopy.