Plastic litter has been a key pollutant of concern in the oceans globally over the past few decades. One of the most abundant forms of marine debris is microplastic - defined as plastic litter smaller than 5 mm.1,2
Microplastics include both small manufactured items like beads and fibers (primary microplastics), in addition to items that result from fragmentation of larger plastic items by a combination of chemical, physical and biological processes and include fragments, foams and films (secondary microplastics).
Plastic marine debris usually starts as land-derived waste and subsequently enters the coastal ocean and estuaries.3 Microplastics distribute throughout the water with the aid of turbulence, tides and ocean currents after entering the marine environment, dispersing them throughout the water column and across the oceans.4
The high biological productivity and rich ecosystems found in coastal environments indicate more frequent biological interactions with microplastics in the coastal region than in the open ocean.5
Although in coastal and estuarine waters, the likelihood of plastic accumulation is higher, few studies have focused on microplastics in these regions.6
It is now vital to broadening the capabilities of research laboratories due to the growth of microplastics research in recent years to routinely analyze the chemical composition of candidate microplastics from environmental samples.
Visual inspection is usually used initially to isolate microplastics from field-collected samples, but this can result in the misclassification of microplastics, in addition to the accidental exclusion of plastic pieces. Spectroscopic methods are vital as they can confirm manual microplastic designation via polymer identification.
Table 1. i-Raman® EX Specifications. Source: Metrohm Middle East FZC
| . |
. |
| Laser wavelength |
1064 nm |
| Maximum laser power at probe |
330 mW |
| Spectral range |
100-2500 cm-1 |
| Detector type |
InGaAs TE-cooled to -15 °C |
Such methods can help establish where material may have come from and may identify additives that themselves could pose negative biological impacts. Typically, polymers, and by extension plastics, produce strong Raman signals.
Figure 1 demonstrates the Raman spectra of bulk polyethylene and polypropylene materials measured with 1064 nm excitation. Based on their spectral features, the plastics can be clearly identified.
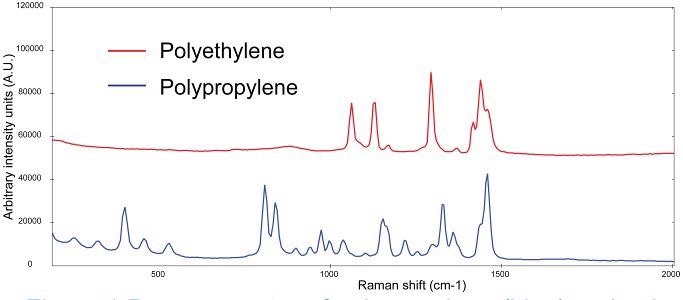
Figure 1. Raman spectra of polyethylene (blue) and polyethylene (red, spectra manually offset for clarification). Image Credit: Metrohm Middle East FZC
For the easy identification of unknown microplastic material, a reference library can also be built (commercial libraries are also available). Although Fourier Transform Infrared (FTIR) spectroscopy is another method that is often utilized for the identification of microplastics, Raman provides easier sampling of small (<100 µm) particles than FTIR.
Raman spectrometers also lend themselves to portability better than FTIR systems, so portable Raman analysis may be employed at the location of sample preparation. This article will outline the utilization of portable Raman microscopy for the identification of microplastics recovered from surface estuary waters.
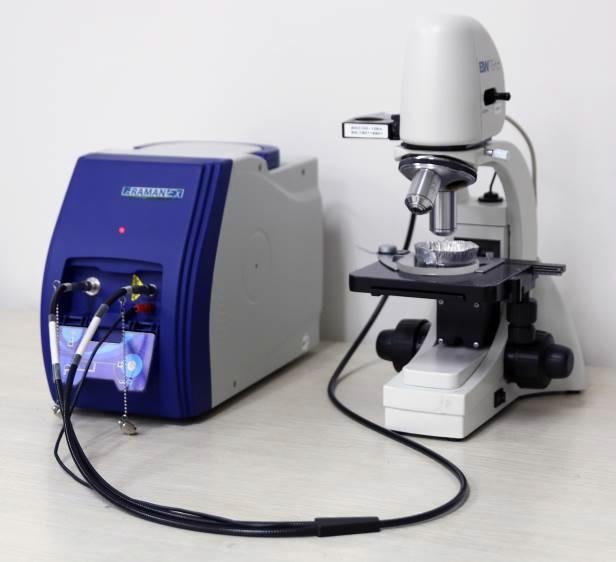
Image Credit: Metrohm Middle East FZC
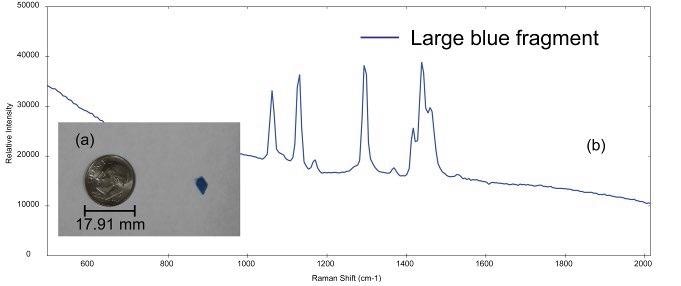
Figure 2. (a) small blue plastic fragment (dime for comparison and (b) Raman spectra acquired from the samples. Image Credit: Metrohm Middle East FZC
Experiment
Water samples were gathered from the surface water of the Delaware Bay (USA) by performing 5-minute tows using a ring plankton net (1 m diameter, 200 μm nitex mesh) fitted with a flow meter.7
Next, the samples were transferred to glass jars and fixed with 4% formaldehyde. The total sample was size-fractionated on stainless steel sieves (5,000; 1,000; and 300 μm).
After drying the samples at 90 °C overnight, wet peroxide oxidation and density separation processes were employed to isolate microplastic from digested organic material in the two smaller size-fractionated samples.8
The microplastics were then gathered onto 200 μm nitex mesh and folded in aluminum foil to dry. Microplastics from these samples were enumerated using manual examination under a stereomicroscope in a laminar flow hood, and each piece was assigned a plastic-type (i.e., rubber, film, foam, fragment, fiber, bead).
Using Raman spectroscopy, enumeration and categorization for plastic identification were performed. An i-Raman® EX portable Raman system with a 1064 nm laser excitation was employed for all measurements; these specifications are shown in Table 1.
The 1064 nm laser excitation is needed to mitigate the fluorescence which is usually produced from colored microplastic samples upon excitation with a 785 nm laser.
A portable video microscope setup with an objective lens of 50× magnification (9.15 mm working distance, 42 µm spot size) was employed to image the microplastics. BWSpec® software was utilized for the data collection.
Integration times ranged from 30 seconds to 3 minutes, and to avoid sample burning, the laser power was kept below 50% of the maximum laser power (<165 mW). The spectra were intensity corrected against a NIST 2244 Raman intensity correction standard, but no other preprocessing was applied to the spectra other than that.
BWID® software was utilized against a reference library of plastics spectra to make the identification of the microplastics.
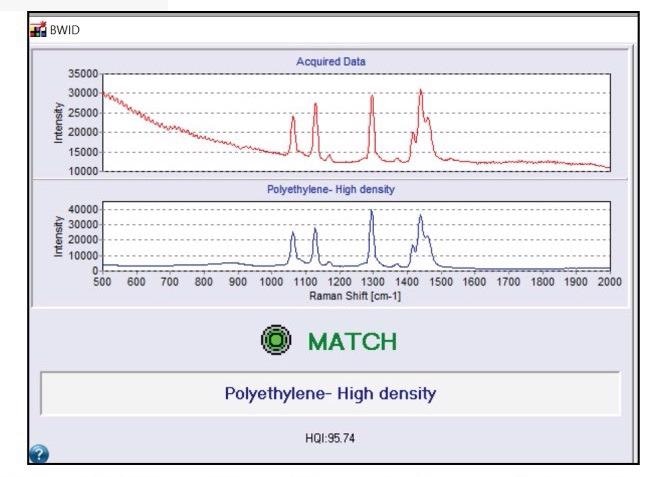
Figure 3. BWID match result for polyethylene. Red spectrum is the acquired sample spectrum from Figure 2. Blue spectrum is the reference spectrum of polyethylene. Image Credit: Metrohm Middle East FZC
Results
The i-Raman EX system was used to analyze a number of microplastics samples of different sizes and types. The photo of a large blue microplastic fragment is shown in Figure 2a.
The diameter of this fragment is ~4.5 mm, which is on the larger end of the size range for a particle to be identified as a microplastic. The sample is likely a secondary microplastic because of the irregular shape of the particle.
The Raman spectrum gathered from the blue fragment is shown in Figure 2b. By using a calculated hit quality index (HQI), BWID software compares the acquired spectrum of the unknown sample to a library of reference materials.
The HQI is a correlation coefficient that measures how similar the reference spectrum is to the sample spectrum. Spectral library search results are ranked from an HQI of 0 (worst match) to an HQI of 100 (best match). For the calculation, a first derivative is applied to the spectra.
There are a number of spectral libraries available for utilization with BWID, and the software also supports custom library building. BWID matched the blue fragment in Figure 2a to a reference spectrum of polyethylene (PE) with a calculated HQI of 95.7, as seen in Figure 3, indicating a strong match.
Other plastic materials were also identified, like polypropylene (PP) and polystyrene (PS).
Figure 4a demonstrates the Raman spectrum gathered from a small, spherical bead and the photomicrograph is shown in Figure 4b. This bead is probably a primary microplastic. BWID matched the spectrum to a reference spectrum of polystyrene with an HQI of 98.2.
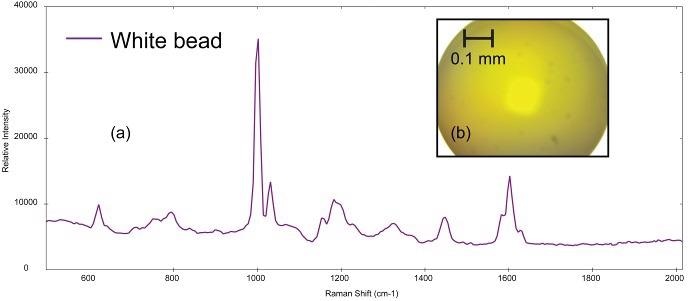
Figure 4. (a) Raman spectrum of polystyrene collected from (b) polystyrene bead (image not true color). Image Credit: Metrohm Middle East FZC
Fibers are a key subgroup of microplastic particles. During the production process, they can be shed from synthetic garments and other plastic textiles, but also through wastewater during routine home maintenance. Synthetic fishing lines are also a key source of microfiber pollution.
The Raman spectrum gathered from the thin, teal fiber is demonstrated in Figure 5a, and the photomicrograph is shown in Figure 5b. BWID matches the Raman spectrum of the sample to a reference spectrum of polypropylene, with a calculated HQI of 74.9.
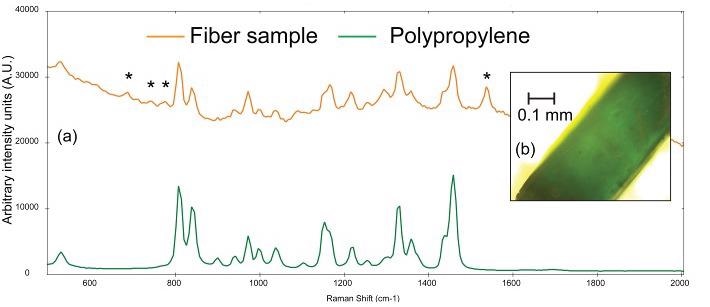
Figure 5. (a) Raman spectra of a teal fiber (orange) compared to a reference spectrum of polystyrene (green) and (b) photomicrograph of teal fiber. The asterisks denote peaks that can be attributed to the colorant used in the plastic. Image Credit: Metrohm Middle East FZC
Although this value may seem low, there are some additional peaks in the sample spectrum that, upon further observation, cannot be attributed to polypropylene.
Upon further investigation, in the sample spectrum, the peak at ~1537 cm-1 and the set of weak peaks from 670-790 cm-1 are consistent with the Raman spectrum of chlorinated copper phthalocyanine green pigment.9
The colorant utilized in the plastic is not usually a vital research question, but it is useful information for establishing the origin of a sample. Table 2 exhibits the summary of the microplastic analysis from the Raman spectra. All materials were identified as polypropylene, polyethylene or polystyrene.
A number of samples had inconclusive results; most of these samples are black microplastic samples that absorb both the scattered radiation and exciting radiation, making their identification with Raman spectroscopy extremely challenging.
The fragility of the microfibers was another limitation that was observed. As higher laser powers may cause distortion and burning of the sample, the laser power applied to fibers should be kept low (around 10% of the maximum laser power).
Table 2. Summary of BWID results. Source: Metrohm Middle East FZC
| Match result |
Number of samples identified |
| PE |
11 |
| PP |
4 |
| PS |
2 |
| inconclusive |
5 |
Conclusions
As the presence of microplastics in marine environments represents a looming threat to our environment, for years to come, their robust characterization will be a vital research topic.
To unambiguously identify these microplastics, Raman microscopy is an effective tool. The employment of near-infrared excitation is vital to mitigate fluorescence from the dyes utilized in the plastics. Software correlation coefficient algorithms are helpful for the simple identification of plastic material.
Acknowledgments
Metrohm Middle East FZC (MME) based out of Sharjah, UAE is the Regional Support Centre for Metrohm AG (Switzerland) which is responsible for sales, service and calibration of lab & process analytical instruments from the following countries –
UAE, KSA, Kuwait, Bahrain, Oman, Qatar, Egypt, Jordan, Lebanon, Iraq, Bangladesh, Pakistan, Sri Lanka, Ethiopia, Ghana, Sudan, Syria, Yemen, Somalia, Iran, Cyprus, Malta, Eritrea, Djibouti & Afghanistan.
Produced from materials originally authored by Jonathan H. Cohen, Policy Taylor Hoffman and Policy Kristen Frano from University of Delaware School of Marine Science.
References
- K.L. Law, Annu. Rev. Mar. Sci. 9, 205-229 (2017).
- T.S. Galloway, M. Cole and C. Lewis, Nat. Ecol. Evol. 1 (2017).
- J. R. Jambeck, R. Geyer, C. Wilcox, T. R Siegler, M. Perryman, A. Andrady, R. Narayan, and K. L. Law, Science. 347, 768-771 (2015).
- R. C. Hale, M.E. Seeley, M.J. La Guardia, L. Mai and E.Y. Zeng, J. Geophys. Res. Oceans. 125 (2020).
- J. R. Clark, M. Cole, P. K. Lindeque, E. Fileman, J. Blackford, C. Lewis, T. M. Lenton, and T. S. Galloway, Front. Ecol. Environ. 14, 317-324 (2016).
- P. Vermeiren, C.C. Muñoz, and K. Ikejima, Mar. Pollut. Bull. 113, 7-16 (2016).
- J.H. Cohen, A.M. Internicola, R.A. Mason, and T. Kukulka, Environ. Sci. Technol. 53, 14204−14211 (2019).
- J. Masura, J. Baker, G. Foster, and C. Arthur, “Laboratory Methods for the Analysis of Microplastics in the Marine Environment: Recommendations for Quantifying Synthetic Particles” in Waters and Sediments; NOAA Technical Memorandum NOS-OR&R-48, National Oceanic and Atmospheric Administration: Washington, DC, 2015.
- A. Duran, M. L. Franquelo, M. A. Centeno, T. Espejoc, and J. L. Perez-Rodrigueza, J. Raman Spectrosc. 42, 48–55 (2011).

This information has been sourced, reviewed and adapted from materials provided by Metrohm Middle East FZC.
For more information on this source, please visit Metrohm Middle East FZC.