Today, more and more people are consuming plant-based milk as consumers look for healthier, non-animal-based options of milk protein. Contrary to animal-sourced milk, plant-based milk production is subject to frequent changes due to variances in crop years and crop sources.
For instance, the same plant can be cultivated in different climates, different weather patterns, or different cultivars, all of which can cause modest to noticeable differences in the constituent concentrations.
To effectively produce high-quality plant-based milk products requires consistent control over intermediate and final product quality. Producers aim to hit their target formulas on quality, cost and labeling concerns.
Fourier Transform Infrared (FT-IR) transmission technology is well-suited for making proximate constituent measurements in liquid plant-based milks. Unlike conventional wet chemistry methods, which can be labor- and time-intensive, FT-IR multiple component analysis can be conducted in less than a minute.
Additionally, FT-IR sample preparation is minimal, which means that the products can be analyzed without drying or making extracts.
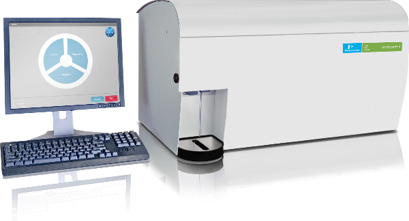
Image Credit: PerkinElmer Food Safety and Quality
The Analysis of Plant-Based Milk
Various plant-based milks are typically comprised of suspensions of solids, which is not like animal-sourced milk. These differences can be seen by centrifuging a plant-based milk sample. In Figure 1, a photo of the plant-based milk is displayed as it looks, and Figure 2 displays what remains of the solid residue in the centrifuge tube. The various elements are noticeably visible.
In Figure 2 it is clear that there are a number of distinct ingredients suspended in the product, from dark flecks to whiter materials. Those are the suspended particles. When analyzing plant-based milk, one must ensure that the product is properly shaken before doing any measurement to unsettle any suspended particles that may be present.
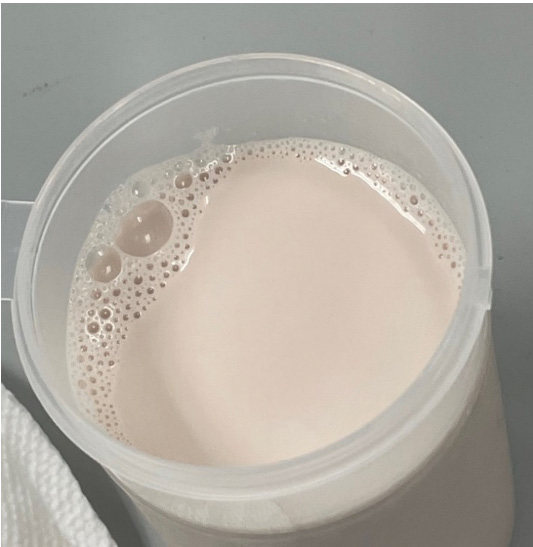
Figure 1. Liquid Plant Milk. Image Credit: PerkinElmer Food Safety and Quality
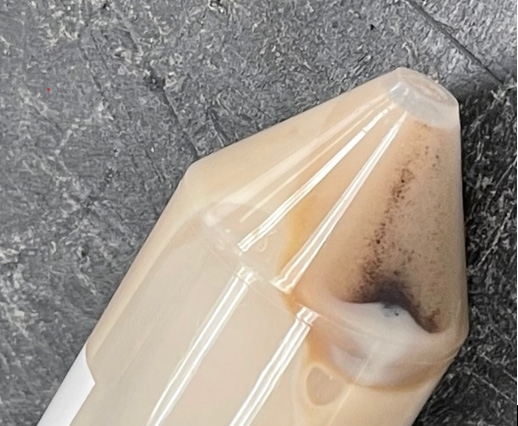
Figure 2. Plant Milk Centrifuged. Image Credit: PerkinElmer Food Safety and Quality
LactoScope
The LactoScope FT-A is a cutting-edge instrument for the compositional analysis of liquid products. With the latest FT-IR optics, it is easy-to-use with powerful software for meticulous analysis.
It complies with both AOAC and IDF for the analysis of fat, protein, lactose and total solids in milk. The Results Plus software is intuitive and offers fast implementation of testing methods with minimal training.
The LactoScope has been designed to make analysis secure and as quick as possible and is compatible with LIMS systems. The instrument sustains its own Microsoft® SQL database of its internal measurements and warnings, spectra and results and operator actions or changes.
Method
Measurements were performed using a LactoScope FT-A in line with the standard protocol. The analysis of over 150 plant-based milk samples was conducted, and the respective spectral data was collected.
The samples analyzed included a variety of plant-based milks and creamers. The list of plant-based milk types is displayed in the following table:
Table 1. Plant Source of Milks Analyzed. Source: PerkinElmer Food Safety and Quality
| Product |
|
| Almond Coconut Creamer |
Macadamia Milk |
| Almond Coconut Milk |
Oat Creamer |
| Almond Creamer |
Oat Milk |
| Almond Milk |
Pea Milk |
| Cashew Milk |
Rice Milk |
| Coconut Milk |
Soy Milk |
| Hemp Milk |
|
Prior to being decanted for analysis, the samples were shaken for ten complete 180-degree rotations. The sample was poured into the 50 ml container, which is then used to feed the LactoScope sample tube. About halfway full, the pour was then transferred to the reference sample container that was sent out for reference chemistry.
Once the reference sample was filled, the pour continued into the LactoScope sample container so that the average value for the FT-IR and reference lab splits were roughly the same even if the product showed some separation.
There are a range of products that clearly separate a bit before they are stocked and sold. Shaking made a significant difference. Reference analysis for protein, fat, total solids and sugars were performed using AOAC or ISO standard methods.
Table 2. Reference Methods Used for Analysis. Source: PerkinElmer Food Safety and Quality
| Parameter |
Reference Method |
| Fat |
Mojonnier Fat AOAC 989.05 |
| Protein |
Combustion (Dumas) ISO 14891 |
| Solids |
Vacuum Oven AOAC 926.08 and 927.05 |
| Sugars |
HPLC – AOAC 984.22 (Modified) |
The Dumas method for protein quantifies the nitrogen content, which is then recalculated to protein utilizing the appropriate conversion factor. This factor varies plant-to-plant. For instance, for soybeans, it is 5.71 and for almonds, it is 5.18.
For beverages with several ingredients, a factor of 6.25 was used as a logical average.
Calibration models were designed to signify the relationships between the collected FT-IR spectra and reference chemistry results using Partial Least squares regression (PLS). Those samples exhibiting strange spectral or concentration deviations were omitted from the calibrations.
Results and Discussion
The table below summarizes the calibration statistics of the calibrations developed:
Table 3. Calibration Statistics. Source: PerkinElmer Food Safety and Quality
| Product |
Parameter |
Unit |
N |
Min |
Max |
R2 |
| Plant Milk |
Fat |
%m/m |
164 |
0.3 |
6.5 |
0.992 |
| Plant Milk |
Crude Protein |
%m/m |
137 |
0.3 |
6 |
0.990 |
| Plant Milk |
Total Sugars |
%m/m |
118 |
0.3 |
27 |
0.993 |
| Plant Milk |
Total Solids |
%m/m |
167 |
2 |
38 |
0.998 |
The diverse range of product variability programmed into the calibrations enable them to be accurate and robust enough for many types of raw and processed plant-based milks.
Individual calibrations for individual products will, in all probability, produce fewer errors as they will have greater consistency when it comes to reference chemistry results because they won’t include as many variables in composition.
For instance, there were samples with a wide variety of sugar types. Here the total sugars were added to produce a single number, but their spectra are slightly different from each other. The Predicted vs. Reference calibration lines for these four constituents are exhibited in the following graphs:
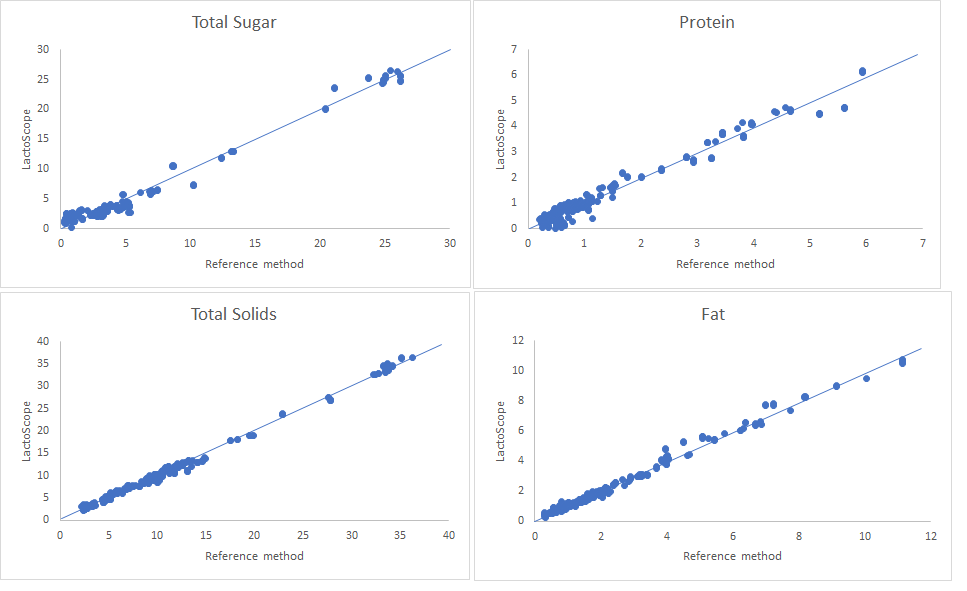
Figure 3. LactoScope vs Reference Methods. Image Credit: PerkinElmer Food Safety and Quality
Conclusion
Even though plant-based milks are considerably different than dairy milks and creams, the fundamental constituents of protein, fat, sugar and solids can be analyzed with the same FT-IR instrument, the LactoScope FT-A.
This study demonstrated that a single uniformed calibration is able to measure the constituent values in a number of mixtures.

This information has been sourced, reviewed and adapted from materials provided by PerkinElmer.
For more information on this source, please visit PerkinElmer.