Sponsored by TOFWERKReviewed by Emily MageeJun 21 2022
Today, atomic layer deposition (ALD) is an essential tool in the semiconductor sector, as it is rapidly becoming a standard technique for a wide range of thin film materials. In order to obtain sub-nanometer control of the thickness and conformity of a thin film, even on substrates with complex 3D geometries, ALD relies on self-limiting surface reactions of two gaseous reactants in sequential mode.

Ben Bensaoula Thun, Switzerland. Image Credit: TOFWERK
Surface decomposition reactions and growth mechanisms are the key influences on the physicochemical properties of the deposited films. It is therefore essential to fully characterize and understand these processes and utilize metrology tools that provide real-time monitoring and control in a production environment and shorten the process optimization cycle.
pgaTOF for ALD
In this article, the integration of the TOFWERK pgaTOF, a new time-of-flight mass spectrometer, in an atomic layer deposition system (SC-1, from Swiss Cluster AG, Thun, Switzerland) is presented and utilized for real-time monitoring of thin film fabrication processes. Simultaneously, the pgaTOF can detect all ionized molecules with isotopic resolution greater than 105 dynamic range, as well as mass spectral acquisition rates up to 1 kHz.
The results of applied deposition parameters can be monitored instantly because the chemical data acquisition is undertaken in-situ, which allows for immediate modifications of the process experimental conditions (such as pulsing/purging times and temperature).
In addition, any process excursion from optimal conditions or equipment malfunction is also detected. This in-situ acquisition with the pgaTOF offers a significant advantage over post-mortem (ex-situ) structural and chemical characterization methods, both of which are characterized with significant delays.
Experimental Set Up
A novel compact cluster system, SC-1, which combines PVD and ALD, was used to perform the ALD process. This study solely used the SC-1’s ALD module, and the substrate temperature was set at 120 °C. In this study, Trimethylaluminium, Al(CH3)3 (TMA, 98% purity, from Strem) and DI H2O were used. Typically, these two gas precursors are used for depositing Al2O3, a model ALD system.
Numerous studies have broadly analyzed the chemistry of this process, which has served for the evaluation of the results presented in this study. Both precursors were delivered at room temperature to the deposition chamber and 99.9995% purity argon (from Air Liquide)
The experiments comprised of 20 ALD cycles. A 50-millisecond pulse of TMA and a 30-millisecond pulse of H2O without Ar carrier gas were included in each cycle, with the aim that only the gases of interest are introduced to the chamber. A 50 sccm argon gas purge over 30 s was provided between the gas precursor pulses.
Results
As described in Figure 1, in ALD, the reactions between the surface and the sequentially introduced gas precursors generated the release of by-products. The amount and chemistry of such by-products offer us valuable information regarding the fundamental reaction mechanisms and provide insight useful for the development of monitoring protocols for reproducible and reliable processes at an industrial scale.
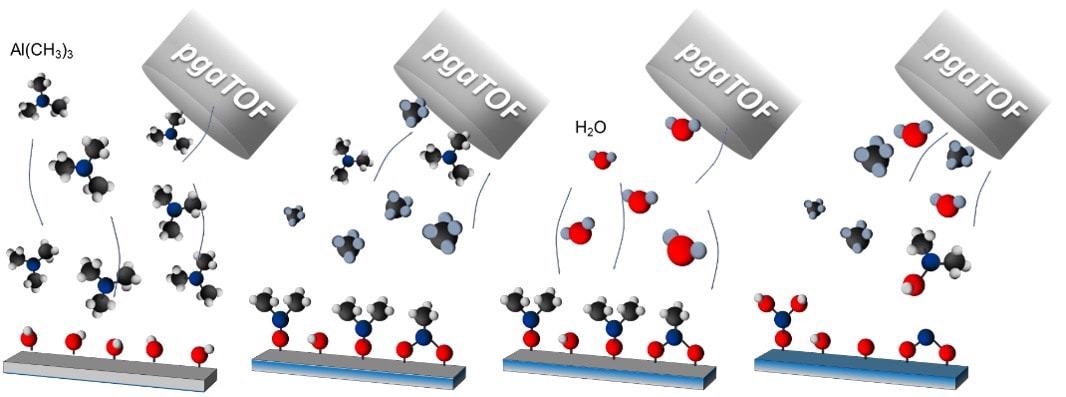
Figure 1. Schematic illustration of a TMA+H2O deposition process and the parallel detection of all the molecules involved in the process. In this example, TMA reacts with OH sites at the surface, forming CH4, and after a purging step, the H2O reacts with the methyl surface, forming mainly CH4 in addition to secondary products such as AlOH(CH3)2. Image Credit: TOFWERK
It has been shown by this study that the Al2O3 deposition using TMA and H2O can be characterized on the basis of the signal distributions measured mainly at m/Q = 16 Th, 18 Th, 27 Th, and 40 Th, corresponding to the TMA Al (27 Th), H2O (18 Th), the by-product CH4 (16 Th) and the Ar carrier gas (40 Th).
However, as shown in Figure 2, the ability to detect all masses simultaneously facilitated the observation of additional by-products which had not been previously detected and which would have been difficult to identify without the high mass resolution and accuracy of the pgaTOF.

Figure 2. The mass spectrum acquired during the entire ALD process consisting of 20 subsequent series of TMA and H2O cycles: a) the full mass spectrum: the strongest signals were observed in the case of process reactants having m/Q < 290 Th, but heavier ions were also detected, b) a selected region of the mass spectrum with assigned potential reaction substrates and by-products. Note the logarithmic scale. Image Credit: TOFWERK
The ability to monitor the time variation of all species present in the reactor is another important feature afforded by the pgaTOF capabilities, as can be seen in Figure 3. Figure 4 shows the 27Al signal distribution’s measured characteristic values, i.e., the 27Al signal peak amplitudes when the TMA valve was open, as well as their full widths at half maximum (FWHM).
The fact that the amount of delivered TMA varied between cycles is indicated by the variations of these two values indicate. Precursor consumption can be optimized despite the fact that the ALD process is self-limiting and the excess of the TMA precursor does not induce an increase in the layer thickness. A lower precursor amount, contrastingly, will produce partial monolayer deposition and result in both rough surface morphology and less-than-ideal interfaces when the goal is the deposition of a heterostructure.
In both process optimization (R&D) and production, the real-time quantification of cycle-to-cycle ALD process reproducibility, made possible with the pgaTOF, is therefore vital.

Figure 3. An in situ pgaTOF integrated within an ALD chamber gives a unique opportunity of monitoring the time evolution of all elements and molecules participating in an ALD process, including products and by-products. The H2O (blue line) and Al (red line) signals represent the gas precursors, whilst N (green line) and Ar (violet line) signals provide information on the vacuum status of the deposition chamber. The time evolution of the 20-cycle deposition process (a) and magnification of the first three TMA and H2O cycles (b) are shown. The pgaTOF data were normalized to 1 for better visualization. Image Credit: TOFWERK

Figure 4. Comparison of Al signal peaks measured during successive TMA injections. The variations of peak height, SAl,max,height@TMA, and width, SAl,max,width@TMA, values provide an indication of amount of delivered gas precursor variation, and therefore the cycle-to-cycle ALD process reproducibility. Image Credit: TOFWERK
Conclusion
To conclude, as this article has underlined, simultaneous, real-time detection of all ionized molecules and fragments is facilitated by the incorporation of a pgaTOF within an ALD system. This means that any malfunction or process deviation from optimal can be detected at an early stage. Consequently, the deposition parameters, like pulse duration, pressure, and precursor temperature, can be immediately rectified to ensure deposition of the intended thin film chemical structure.
There are numerous advantages of in situ pgaTOF analysis for this ALD process which naturally extend to other deposition techniques, like chemical vapor deposition and etch applications for process optimization, monitoring and control.
For complex interfaces like transitions involving binary, ternary and quaternary alloys, end-point detection could be implemented. Moreover, for sources operating in pulsed modes and processes involving deposition and etch of nanolayered stacks, this high acquisition speed is critical. Where chemical species in complex gaseous environments need to be accurately assigned and their time variation measured, the pgaTOF can therefore be broadly applied as a monitoring tool in other semiconductor processes.
Acknowledgments
TOFWERK would like to thank EMPA Eidg (Thun) and Swiss Cluster (Thun) for their data collection and analysis contributions to this article.

This information has been sourced, reviewed and adapted from materials provided by TOFWERK.
For more information on this source, please visit TOFWERK.