Sponsored by EDAXJan 31 2023Reviewed by Olivia Frost
Integrated Energy Dispersive Spectroscopy (EDS) and Electron Backscatter Diffraction (EBSD) systems, also known as EDAX Pegasus Analysis Systems, provide users with a comprehensive characterization of their samples. EDS offers insight into the elemental composition of the sample, while EBSD offers information on the crystallographic structure and orientation.
The APEX Software, which has a user-friendly interface, facilitates the learning and operation of the system. EDS and EBSD data can be easily acquired simultaneously with a single button press. To prepare for EBSD analysis, samples must be positioned correctly, and the EDS and EBSD detectors must be configured on the SEM to point towards the sample in this position, which is the standard geometry for Pegasus Systems.
Simultaneous data collection enables optimal correlation between the EDS and EBSD signals, as they originate from the exact location during mapping. This article presents some information that can be obtained with integrated EDS-EBSD data for comprehensive characterization.
Results and Discussion
Simultaneous EDS and EBSD data were acquired from a nickel alloy brazed with a High Entropy Alloy (HEA) filler using an Octane Elite Plus EDS Detector and a Velocity Super EBSD Detector.
Benjamin Schneiderman and Professor Zhenzhen Yu of the Colorado School of Mines provided the sample. Figure 1 illustrates an EBSD map that displays the Image Quality (IQ) measurement in grayscale, along with the Inverse Pole Figure (IPF) orientation map (relative to the surface normal direction) in color.
Twin boundaries within the material are depicted with white lines. Both the nickel alloy and HEA filler possess face-centered cubic structures.
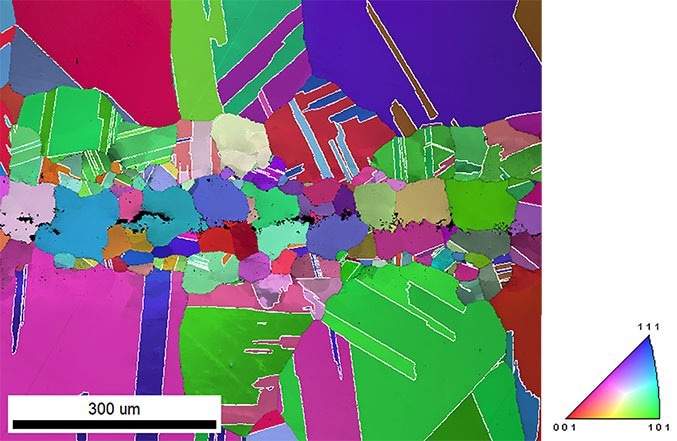
Figure 1. An EBSD map with the IQ measurement displayed as a grayscale image combined with the IPF orientation map (relative to the surface normal direction) displayed in color. Image Credit: EDAX.
The image in Figure 1 demonstrates the braze line horizontally in the middle of the frame, with the nickel alloy located at the top and bottom of the field of view. The nickel alloy exhibits a larger grain size, along with a significant number of twin boundaries, whereas the HEA filler displays smaller grains with few twin boundaries.
There is a transition region of smaller grains with twin boundaries at the Ni-HEA interface. This type of information is commonly obtained through EBSD analysis.
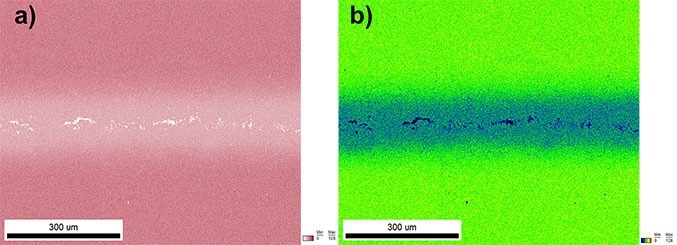
Figure 2. a) An EDS elemental map from nickel collected simultaneously with the EBSD data, with a single-color intensity showing the number of EDS counts per pixel. b) A black-to-thermal coloring scheme is used, highlighting three regions of nickel concentration: a higher region in the nickel alloy, a lower region in the HEA filler, and a depletion region in the center of the braze. Image Credit: EDAX.
Figure 2a illustrates an EDS elemental map of nickel, which was collected simultaneously with the EBSD data. It is represented by a single-color intensity, indicating the number of EDS counts per pixel. This image depicts the reduced concentration of nickel within the HEA braze material.
As shown in Figure 2b, a black-to-thermal coloring scheme is employed to highlight three locations of nickel intensity: a higher zone in the nickel alloy, a lower zone in the HEA filler, and a depletion zone in the middle of the braze.
Several EDS elemental maps may also be blended into a single picture, as seen in Figure 3, which uses an RGB image. The red channel represents nickel intensity, the green channel oxygen intensity, and the blue channel cobalt intensity.
This image illustrates that the HEA filler has a higher cobalt concentration, with regions of higher oxygen corresponding to regions of less nickel. This type of information is typically obtained through EDS analysis.
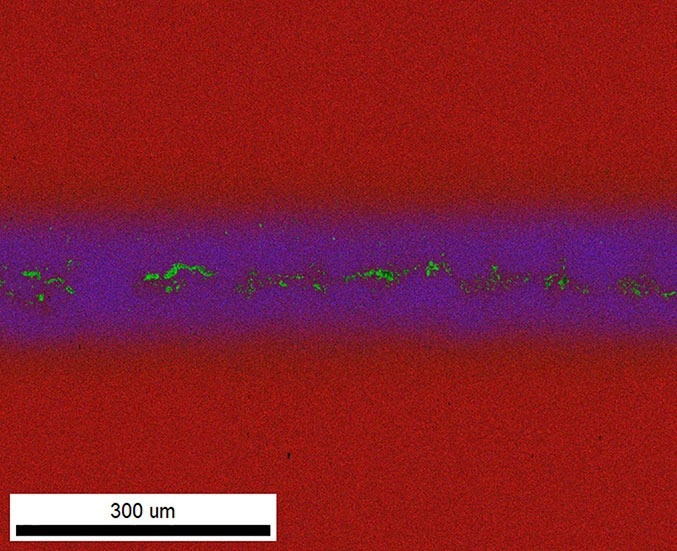
Figure 3. A combined RGB image. The red channel shows the nickel intensity, the green channel shows the oxygen intensity, and the blue channel shows the cobalt intensity. Image Credit: EDAX.
Figure 4 illustrates some of the synergistic advantages of integrated EDS-EBSD analysis. The EDS RGB coloring is the same as in Figure 3, but the grain boundary information obtained from simultaneous EBSD data is also displayed. Twin boundaries are depicted as white lines and random high-angle grain boundaries are shown as black lines.
This information enables a direct correlation and analysis of the chemical and crystallographic components of the microstructure. This example demonstrates that some grains at the Ni-HEA interface exhibit a compositional gradient.
This integrated EDS-EBSD data allows for a more comprehensive knowledge of the diffusion, grain formation and development, and twinning processes that may be at work during the brazing process.
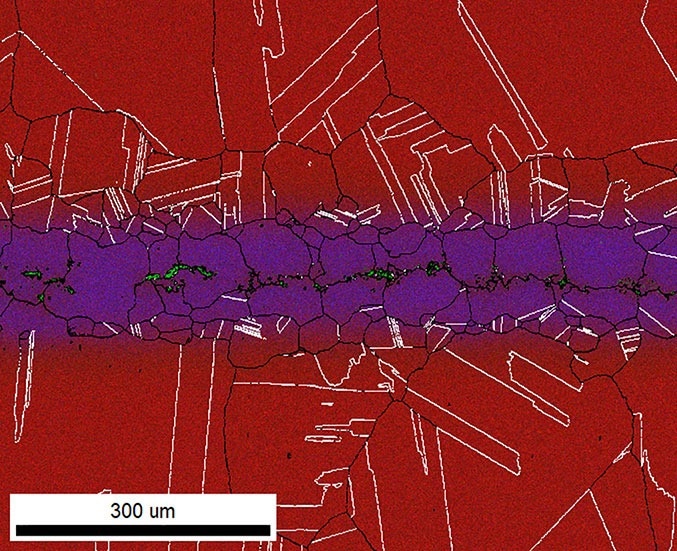
Figure 4. This combined RGB map shows the same EDS coloring as Figure 3, with added grain boundary data from simultaneous EBSD collection. Image Credit: EDAX.
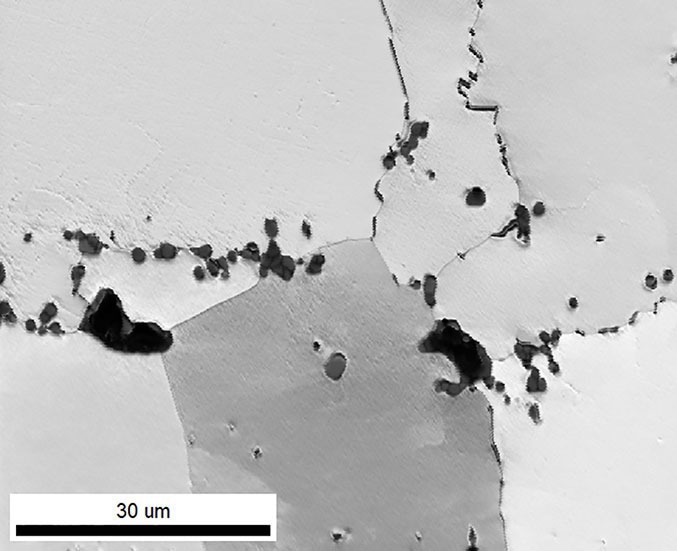
Figure 5. An IQ map at a higher magnification within the center of the braze region. Image Credit: EDAX.
Pegasus Systems also contains innovative tools for advancing combined EDS-EBSD analysis. Figure 5 depicts an IQ map at a greater magnification inside the braze area. This picture shows several tiny precipitates inside the microstructure.
The EBSD data show that the majority of precipitates are positioned at grain borders, although a lesser proportion of precipitates are present inside grains. To further detect and describe these precipitates, integrated EDS-EBSD data is used to calculate a grain-averaged EDS concentration. This method considerably minimizes noise in the EDS data.
The data may then be utilized for ChI-Scan™ analysis, which uses averaged EDS data to distinguish crystallographically identical phases. Figure 6 depicts the resulting phase map. This research thoroughly characterizes each precipitate for composition and crystallography, and this information may be utilized to better understand how the distinct precipitate types formed during brazing.
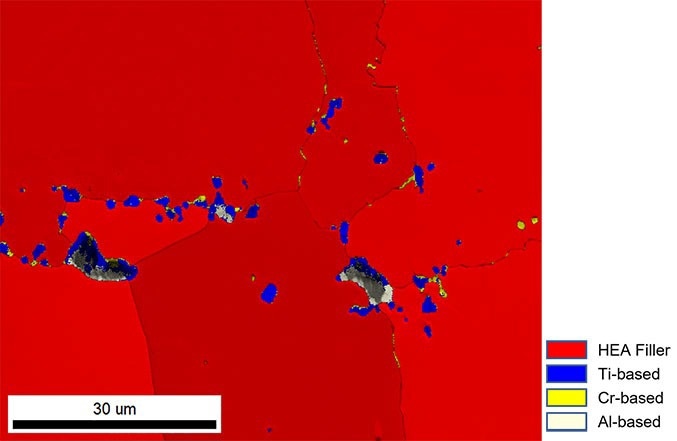
Figure 6. A phase map was created using ChI-Scan analysis. Image Credit: EDAX.
Conclusion
Integrated EDS-EBSD analysis is a powerful tool that enables the comprehensive characterization of microstructures. It is easily accessible through the user-friendly APEX Software, which facilitates fast and efficient materials analysis.

This information has been sourced, reviewed and adapted from materials provided by EDAX.
For more information on this source, please visit EDAX.