In this interview, we speak with Dr. Alice Merryweather, Founder and Lead Scientist at illumion, about charge photometry and how the technique can be used for battery screening and development.
What is your role at illumion?
My name is Alice Merryweather, and I am one of the founders of illumion.
illumion is a relatively new spin-out company that came out of the University of Cambridge in December 2022. The company is developing Charge Photometry, a technique first established within the University of Cambridge in Professor Akshay Rao and Professor Dame Clare Grey’s research groups. Now, we are bringing this technique to the general market for battery research.
What is charge photometry and why is it such an important technique?
Charge Photometry is a new characterization technique in which we can map the changing state of charge in battery electrodes. It is essential that we understand and monitor spatial variation in electrochemical activity within cycling electrodes, as this will enable us to improve battery capabilities in the future.
There are a few reasons why this is generally difficult. First, battery electrodes continually operate under non-equilibrium conditions when the battery is cycling, which means you need operando characterization techniques to capture all those dynamic processes. The other thing is that battery electrodes are highly heterogeneous.
If we want to capture the whole picture, we ideally want single particle resolution to monitor that heterogeneity in the electrode. Charge photometry brings together those two requirements - we have an operando technique that can resolve these processes on a single particle scale.
Can you tell us more about illumionONE?
Our instrument, illumionONE, is a benchtop device that utilizes an optical microscopy-based technique to offer operando insights into those varying states of charge within the individual particles and their changing morphology. Electrochemical control is fully integrated within the microscope, so everything is well synchronized.
We study batteries in optically accessible coin cells, that are the standard CR2032 geometry with a glass window inserted into the lid - we image a region of the electrode next to the glass window. You put the cell into the instrument and illuminate the electrode surface via that window, collecting the light scattered back from the electrode to form an image.

Bench-top charge photometry instrument. Image Credit: illumion
Can you talk a little more about light scattering, particularly regarding batteries?
The key concept here, which is essential, is that the intensity of light scattered from any sample depends on its polarizability.
For batteries, lithiation processes - if we are talking about lithium-ion batteries - will change the electronic properties of that sample, which in turn will alter the polarizability and the intensity of light scattered from the sample.
That means that if we are lithiating or delithiating an electrode, the amount of light scattered from the material will change as a function of that state of charge, which will allow us to visualize and track those processes in real time.
This is a general phenomenon, which means it is agnostic to the underlying battery chemistry. It can be applied across a wide range of electrode materials within lithium-ion batteries, sodium-ion batteries, or other types of battery technology.
What are some of the applications of charge photometry?
Charge photometry has several applications. It can be used for optimisating electrode formulations, as it is possible to identify the proportion of material that is active and inactive, and, therefore, where performance is lost. It can also be applied to investigating the mechanisms limiting the rate of lithiation and delithiation, from observing state of charge heterogeneity within active particles. Furthermore, it can be utilized in probing material degradation pathways leading to mechanical cracking and accelerated capacity loss, thanks to real-time visualization of developing ion-gradients and morphological changes within active particles.
Can you tell us a little more about electrode optimization?
I will discuss a case study in electrode optimization where we looked at a single-crystal nickel-rich NMC material. In performing a charge/discharge cycle on our microscope, we obtained an image of part of the electrode, with bright spots representing the individual active particles.
From this, we plot a graph of cell voltage and mean image intensity during a cycle as they change. We saw that the particles became brighter in the first part of the process when they were being delithiated, and then darker when they were being lithiated - behaviour which is reflected in the mean intensity graph. In this way, scattering intensity can qualitatively track and map the local changes in the state of charge in active particles.
We can also look at what different individual active particles are doing, and plot their individual intensity changes. Take an example where we have two particles doing more or less the same thing simultaneously at a C/3 cycling rate. However, when the applied current was increased, one particle lagged, not doing much in the first half of the charge but catching up quickly in the second half.
We directly visualized local variations in current, showing that the de(lithiation) rate between nearby particles in the same electrode was heterogeneous.
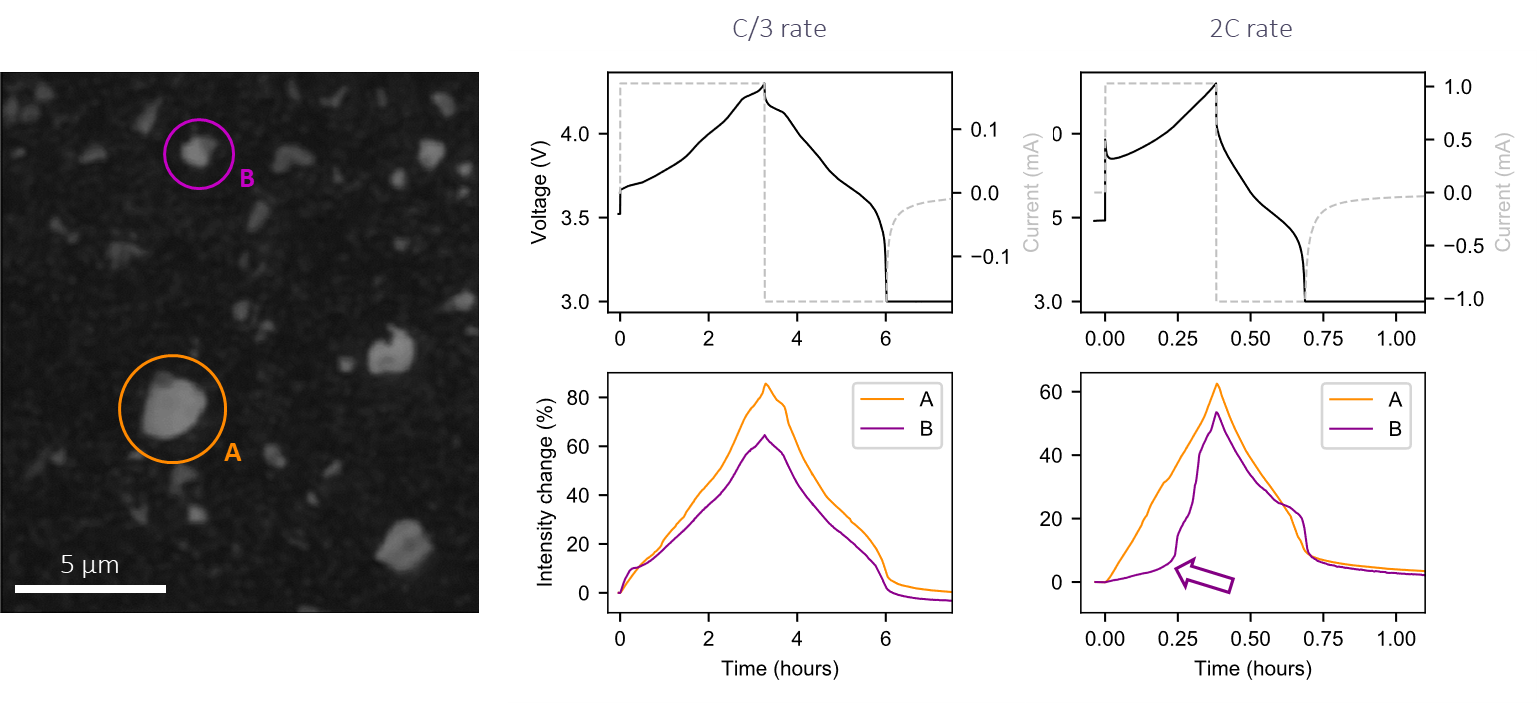
Intensity traces from individual particles used to start identifying heterogeneity. Image Credit: illumion
We can extend this kind of analysis to a much larger field of view and look at hundreds of particles simultaneously. We can track the intensity traces from all of these individual particles and start to identify heterogeneity. We can look for particles that behave in sync with the rest of the electrochemistry and those that are lagging or inactive. From this, we can start to quantify these different behaviors statistically.
To obtain statistical quantification of inactive particles, we can use an automatic particle segmentation algorithm to identify all particles within an image automatically. A simple metric quantifies how much each particle changes in intensity during a cycle.
Maximum relative intensity change - the maximum intensity reached by each particle - divided by its initial intensity, gives you the fractional intensity change.
Plotting this relative intensity change enables us to quantify how many active or inactive particles there are in an electrode and monitor how this changes as a function of cycles and cycling protocols.
We can take this analysis further by looking at where active and inactive particles are distributed across an electrode surface. For example, you may see clusters of inactive particles at the edge of an electrode, as we showed in one case.
This suggested that near the edge of the electrode, there were local regions of poor electronic conductivity because of the interrupted current collector and structure of the electrode. This indicates why these particles are inactive – they are not very well connected to the rest of the electrode.
Charge photometry can also be used for fast charging. Can you elaborate on its applications in this area?
Going back to the single-crystal NMC system, rather than looking at variations between different individual active particles, we can look at local variations in the lithium-ion state of charge within them.
We took four images representing the same active particle over the first half an hour or so of a C/3 charge. The particle became brighter with a buildup of an intensity gradient within the particle as delithiation occurred. Within 25 minutes, the particle's core remained fully lithiated, whereas the periphery became partially delithiated. We got this very pronounced lithium-ion gradient building up in the particle at the beginning of the charge.
A lithium-ion gradient indicates solid-state ion diffusion limitations. We know such a diffusion limitation restricts the kinetics and hence the rate of charging at the beginning of charge, when we have these high lithium occupancies. Hence we can use charge photometry to investigate what limits charging performance.
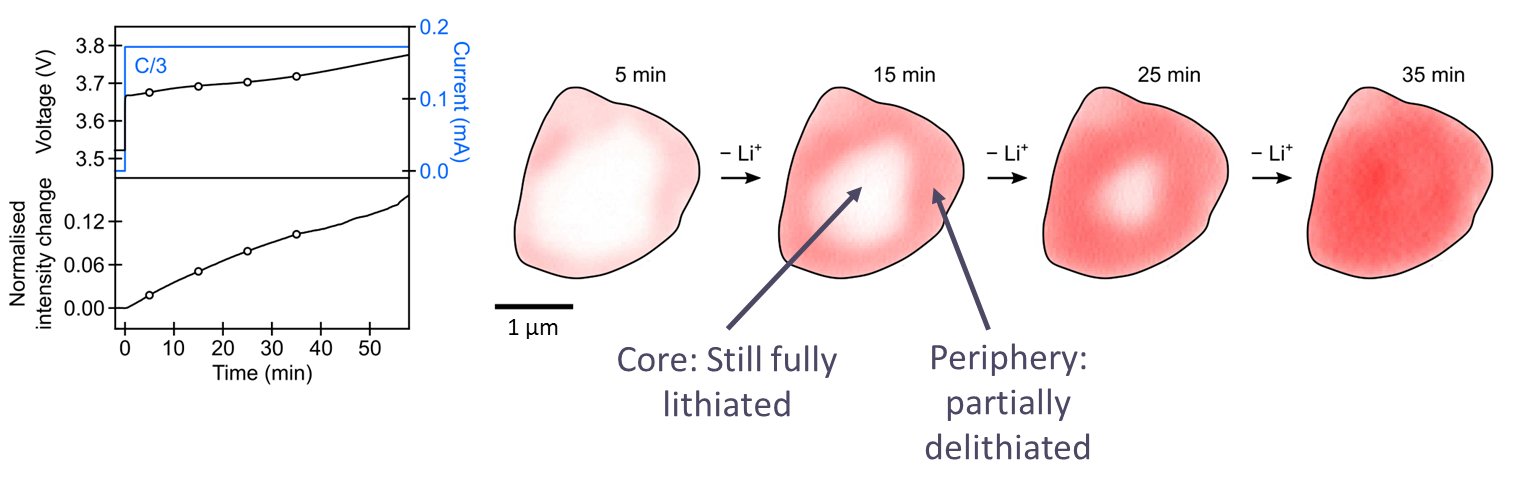
A particle becomes brighter with the buildup of an intensity gradient within the particle as de-lithiation occurs. Image Credit: illumion
Another example of accessing fast charging processes is a case study we did on niobium tungsten oxide, an emerging anode material for high-rate applications. It can cycle at 20C or even faster. These kinds of timescales would usually be really difficult to access with operando measurements because not many imaging techniques can acquire images quickly enough to keep up with rapid cycling rates.
However, when examined with charge photometry, our rapid image acquisition capabilities could more than keep up. We were able to acquire real-time visualisation of the very rapid lithium ion gradients developing, highlighting the diffusion path of the lithium ions along the length of the rod-shaped particles. Charge photometry can capture rapid processes in charging and discharging electrodes.
Finally, how can we use charge photometry for material degradation applications?
Let's consider niobium tungsten oxide again. We see the rod-shaped particles expand and contract with the lithiation cycle. This is fine when we are cycling relatively slowly, for example, at a 1C cycling rate, but it gets more interesting if you increase the cycling rate to 5C. Now, lithium concentration gradients develop along the rod-shaped particles, wherein the ends of the rod are brighter than the center.
The stresses and strains these induce cause cracks to then propagate across the particles. We can observe this happening in real-time and know exactly when in the cycle it is happening, where, and under what conditions.
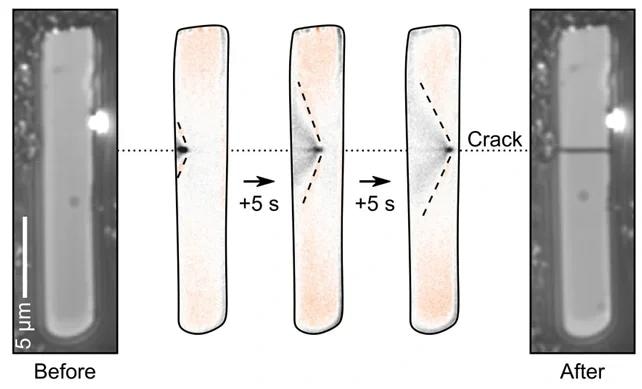
Sequence of images showing the real-time observation of a particle cracking using charge photometry. Image Credit: illumion
We can probe this in more detail by looking at multiple particles simultaneously. By plotting the number of cracks and fragments observed in a fixed population of these particles over a certain number of cycles, we identified that faster rates of lithiation induced more cracking in the niobium tungsten oxide active particles.
We also examined which types of particles were cracking. We plotted the lengths of the rod-shaped particles and assessed whether they either cracked or survived after each cycle. In niobium tungsten oxide, particles that cracked were almost always significantly longer than those that did not crack.
By contrast, when looking at the cross-sectional width of this set of particles, there was no obvious correlation between likelihood of cracking and particle width. This provided really valuable information in terms of what morphologies might be good to target for this particular class of materials.
Occasionally, our instrument identified cracked particles with fragments scattering light more brightly than others. The scattering intensity changes with the amount of lithium in the material, suggesting that these brightly scattering fragments contain trapped lithium and, at some point, have become electrically disconnected from the rest of the electrode.
This was a relatively rare effect in our case studies. Around three percent of fragments showed evidence of this trapped lithium, but this was only over 15 cycles. Therefore, it would be really useful to understand this process and how it might impact capacity fade and loss of lithium inventory over a prolonged number of cycles.
What is next for illumion? Is there any further information our readers should know?
The illumionONE optical microscope offers operando insights into the changing state of charge and particle morphology whilst a battery is operating, with fully integrated electrochemical control. It is a plug-and-play benchtop instrument that can be operated at high throughput to examine lots of different types of battery electrode systems.
The illumionONE microscope will be launched in 2024. If you would like more information about it, please get in touch. We are always on the lookout for collaborations and we have an early adopter discount program.
If you would like to read about some of the case studies introduced in this interview, please read our whitepaper.
About Dr. Alice Merryweather
Dr. Alice Merryweather is the Founder and Lead Scientist at illumion.
She holds a PhD from Cambridge, and is a Junior Research Fellow and Faraday Institution Researcher.

This information has been sourced, reviewed and adapted from materials provided by illumion.
For more information on this source, please visit illumion.
Disclaimer: The views expressed here are those of the interviewee and do not necessarily represent the views of AZoM.com Limited (T/A) AZoNetwork, the owner and operator of this website. This disclaimer forms part of the Terms and Conditions of use of this website.