Sponsored by Gatan, Inc.Reviewed by Olivia FrostFeb 17 2023
Many significant technologies of the twenty-first century rely on lithium-containing compounds and alloys, from Li-ion batteries used to power mobile electronic gadgets and automobiles to lightweight structural alloys.
Despite the lack of a method to determine lithium content at the microscale, progress in these fields has been remarkable. More often than not, to carry out microanalysis, energy-dispersive X-ray spectroscopy (EDS) in the scanning electron microscope (SEM) is employed.
However, for elements with atomic number (Z) < 4, this has not been achieved since the distinctive X-rays released (e.g., Li K at 55 eV) are readily attenuated by the sample or the presence of an oxide layer or contamination, necessitating the employment of very specialized detectors.
However, the inability to perform quantitative measurements due to the dependence of the fluorescence yield on the Li bonding state and a limit of detection of ~20 wt. % Li presents major issues.1
It has recently been proposed that elemental Li maps obtained with these detectors are unreliable.2
However, researchers at LKR/AIT recently accomplished Li quantification in the SEM utilizing a composition by difference technique employing EDS and quantitative backscattered electron imaging (qBEI).3, 4
The elements Z = 4 - 94 were quantified using EDS, whereas the mean atomic mass was determined using qBEI (the qBEI signal being a function of atomic number for Z = 1 - 94). Given the MgLi alloy investigated, the proportion of light elements (Z = 1 - 3) was computed and presumed to be Li.
The detection of < 5% Li using this lithium by composition by difference technique (Li-CDM) was proven with acceptable accuracy (~1 wt. %).
Gatan and EDAX have launched the Cipher™ System, which combines the EDAX Octane Elite or Elect Super EDS Detectors with the Gatan OnPoint™ backscatter electron sensor and a composition-by-difference module for DigitalMicrograph® software to objectively quantify a sample's lithium content.
This article evaluates the accuracy of Li-CDM in a variety of non-metallic materials and describes the most recent results obtained by using Cipher to assess the lithium content in a stoichiometric lithium aluminate and a lithium nickel manganese cobalt oxide powder, both of which are commonly used in Li-ion battery cathode materials.
Materials and Methods
Cipher was used to record quantifiable backscattered electron measurements from 55 specimens (Micro-Analysis Consultants Ltd). The samples varied in atomic number from 4 to 83 and comprised elemental, mineral, semiconductor, and alloy materials.
To prevent charge in the SEM, the samples were manually polished and coated with a 2.0 nm thick carbon layer using a Gatan PECS™ II broad argon beam system.
Cipher was used to perform quantitative lithium analysis on two commercially accessible samples: a high purity (>99.99%) LiAlO2 (100) crystalline substrate and a powdered Lithium Nickel Manganese Cobalt Oxide (NMC) with a theoretical Ni:Mn:Co ratio of 8:1:1 and 5.7 wt.% Li (about 25 at.%).
To prevent charge, the samples were made by wide beam argon milling with a Gatan Ilion® II or PECS II polisher and covered with a 2.0 nm thick carbon layer. The NMC 811 powder specimen was implanted in epoxy to produce a solid block before sample processing.
A field emission SEM was utilized to gather EDS and qBEI data at 20 and 25 kV, respectively, to guarantee that all X-Ray lines were effectively stimulated while also giving equivalent signal sampling volumes.
To disclose the crystal structure, electron backscatter diffraction (EBSD) was done on a commercial NMC sample utilizing the Clarity™ detector.
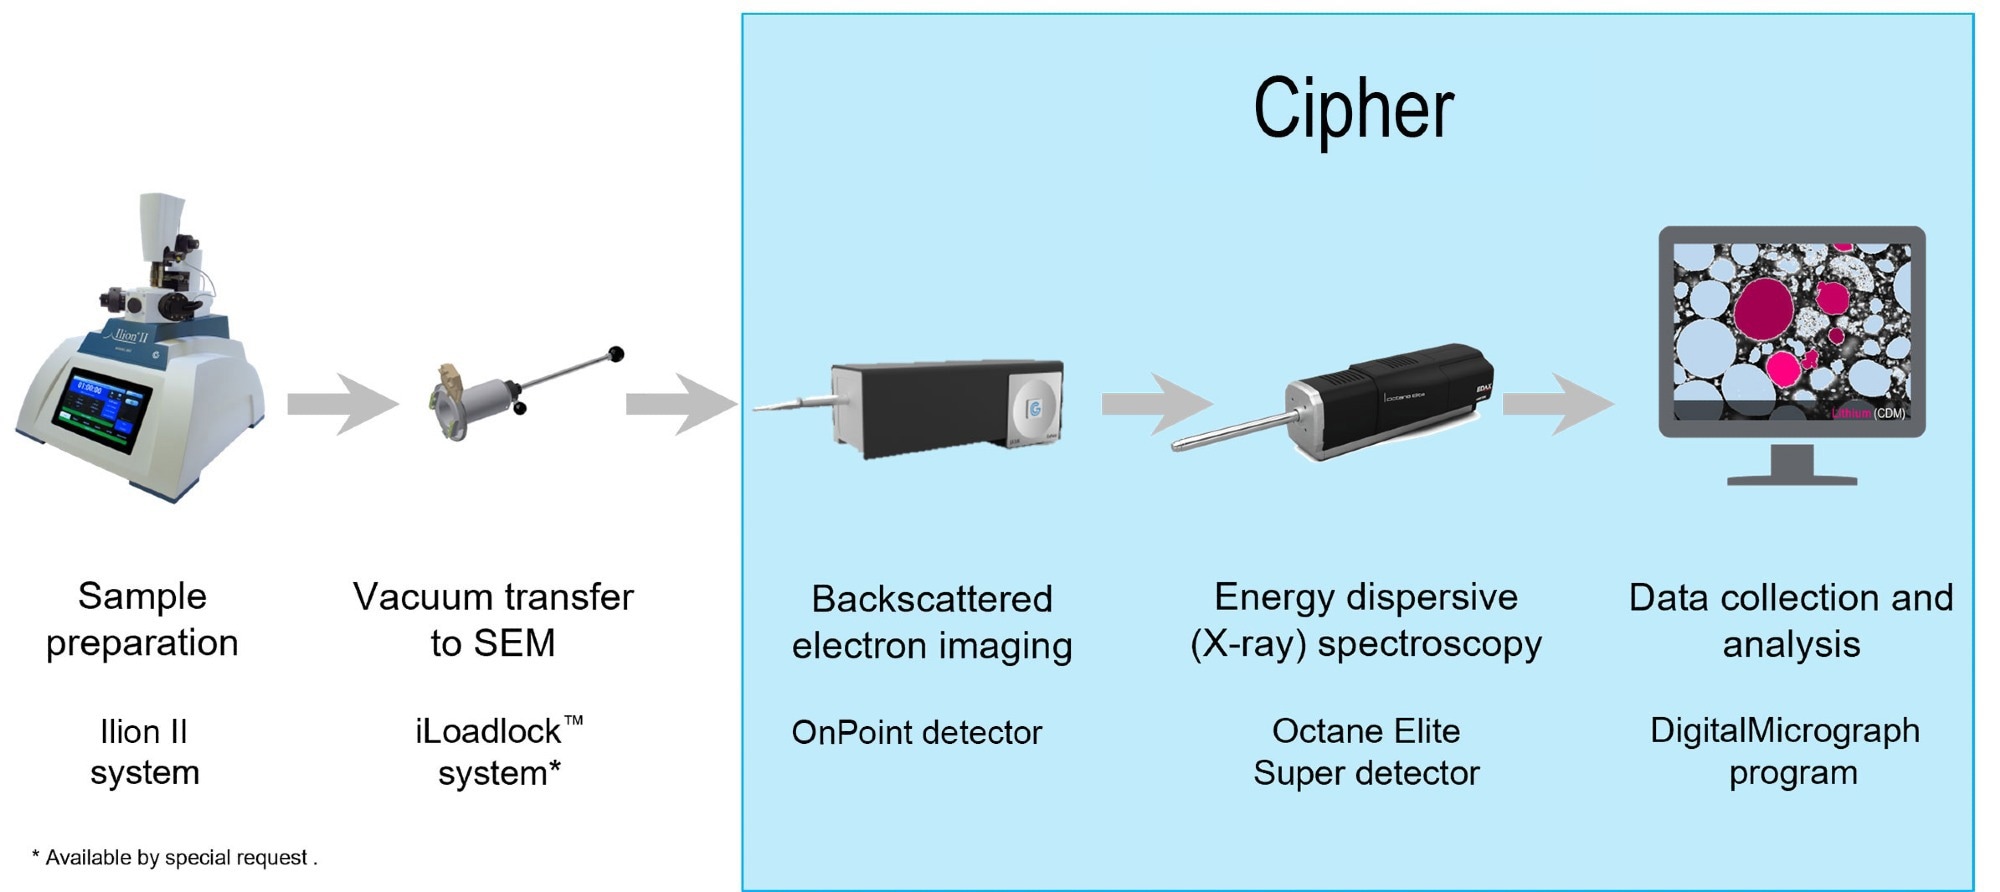
Figure 1. The Cipher system recharges your lithium research allowing you to perform quantitative analysis of the lithium content in a sample for the very first time. Image Credit: EDAX.
Results and Discussion
Assessing the Applicability of Li-CDM to Compound Materials
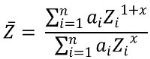
Figure 2 depicts the qBSE signal in terms of mean atomic number, Z, determined using the modified electron method of equation (1):5
 |
(1) |
Equation 1.
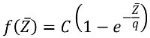
where ai represents the atomic fraction of element i and x ≃ 0.7. In line with other publications,6 the qBSE signal was fitted to the function:
 |
(2) |
Equation 2.
where C and q are constants related to the SEM and detector settings.
For compounds with Z < 40, a good fit of the experimental results to the exponential curve of equation 2 was found, with few, if any, outliers.
However, for materials of Z > 40, although the experimental results continue to follow the overall trendline, the increasing dispersion of the experimental data shows that a considerable uncertainty in the Li-CDM calculation is to be anticipated.
Regardless, it was proven that the Li-CDM is acceptable for a wide variety of metallic and non-metallic specimens of Z < 40.
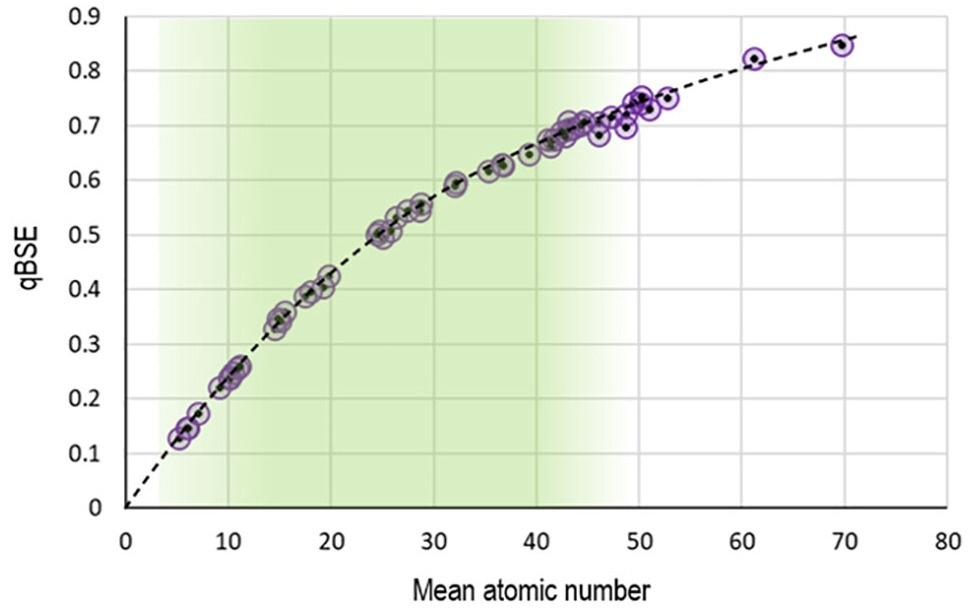
Figure 2. Plot of normalized backscattered electron gray levels against the mean atomic number. The mean atomic number of compound materials was calculated using the modified electron approach of equation (1). The circles are experimental data, and the dotted line is the exponential fit function from equation (3). Image Credit: EDAX.
Evaluating the Lithium Content of Lithium Aluminate
The lithium concentration of a lithium aluminate sample was determined using Cipher. Table 1 summarizes the compositional analysis findings. The lithium concentration was found to be 22.6 ± 3.5 at.% (9.5 ± 1.7 wt.%), which was within 2.4 at.% and just 0.9 wt.% of the nominal composition of 25.0 at.% (10.5 wt.%).
Table 1. Elemental quantification results of LiAlO2 sample. Source: EDAX
| |
Li |
Al |
O |
| By stoichiometry |
| At. % |
25.0 |
25.0 |
50.0 |
| By EDS |
| At.% |
- |
29.6 |
70.4 |
| Std. dev. |
- |
1.6 |
5.1 |
| Li composition-by-difference |
| At. % |
22.6 |
22.9 |
54.6 |
| Std. dev. |
3.5 |
1.0 |
4.0 |
Evaluating the Lithium Content of Li-ion Battery Cathode Materials
The NMC 811 powder tested consisted of roughly spherical secondary particles ranging in diameter from 5 to 30 µm. These secondary particles are agglomerates of smaller 'principal' particles that may be seen in an electron backscatter diffraction (EBSD) crystal orientation map (Figure 3).
The orientation map obtained by the EDAX Clarity EBSD Detector exhibits main particles ranging in size from 200 to 2000 nm, with random crystal orientations and low/no gaps between them.
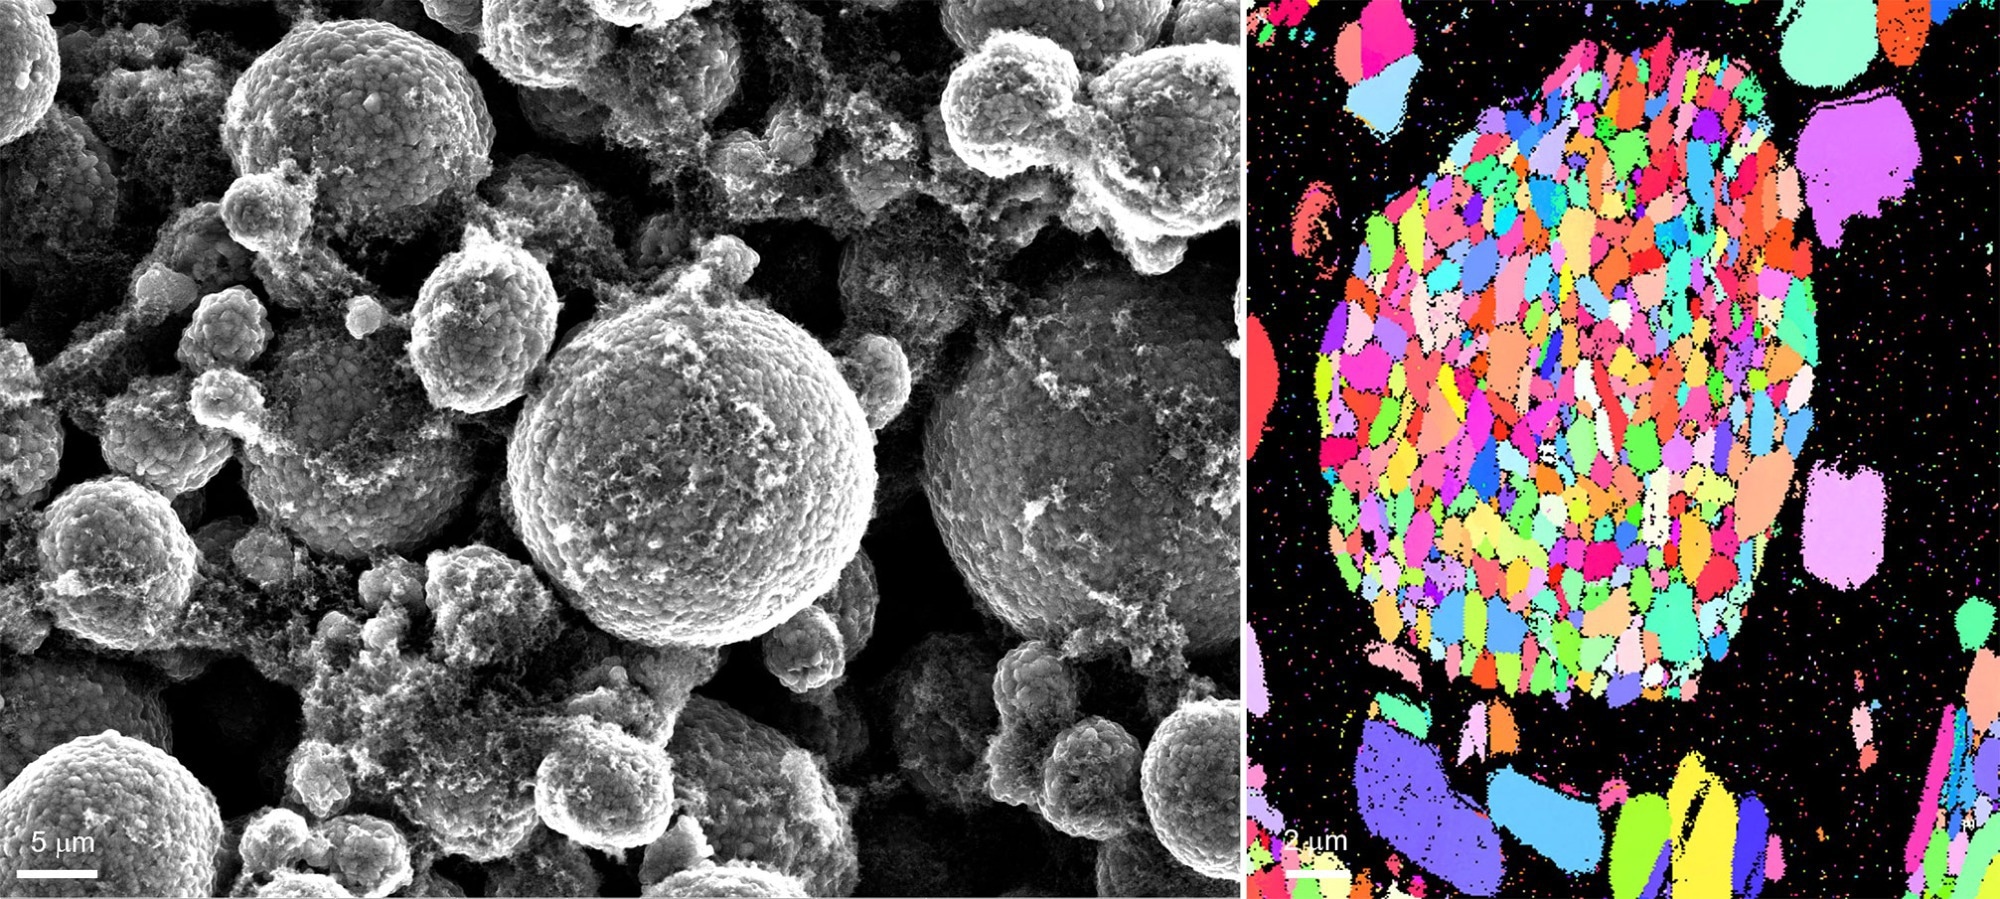
Figure 3. An example secondary electron image and b) orientation map of a lithium nickel manganese oxide powder sample. Image Credit: EDAX.
Quantitative EDS analysis was done at selected places inside NMC particles and showed O, Ni, Mn, and Co with little-to-no change within or between the particles tested (Table 2).
There were no further components detected above the minimum detection threshold. The experimental Ni:Mn:Co ratio of 8.07:1.00:1.01 was found to be compatible with the nominal 8:1:1 ratio.
Table 2. Quantitative EDS analysis of six NMC particles. Analysis positions as shown in Figure 4. Source: EDAX
| Expectation per nominal (at. %) |
| Li |
O |
Ni |
Mn |
Co |
|
Ni |
Mn |
Co |
| - |
66.7 |
26.7 |
3.3 |
3.3 |
|
8.00 |
1.00 |
1.00 |
| Experimental (at. %) |
| |
O |
Ni |
Mn |
Co |
|
Ni |
Mn |
Co |
| Spot 1 |
73.3 |
21.3 |
2.7 |
2.7 |
|
7.89 |
1.00 |
1.00 |
| Spot 2 |
74.4 |
20.3 |
2.6 |
2.6 |
|
7.81 |
1.00 |
1.00 |
| Spot 3 |
72.8 |
21.8 |
2.7 |
2.7 |
|
8.07 |
1.00 |
1.00 |
| Area 1 |
73.0 |
21.4 |
2.7 |
2.9 |
|
7.93 |
1.00 |
1.07 |
| Area 2 |
71.7 |
22.9 |
2.7 |
2.7 |
|
8.48 |
1.00 |
1.00 |
| Area 3 |
73.2 |
21.5 |
2.6 |
2.6 |
|
8.27 |
1.00 |
1.00 |
| Mean |
|
8.07 |
1.00 |
1.01 |
Cipher was used to assess the lithium concentration of six distinct NMC particles; analysis sites are presented in Figure 4. The mean lithium concentration was determined to be 22.5 at. % (5.7 wt. %) and within ~1.5 wt. % of the nominal composition value of 7.3 ± 0.3 wt. %.
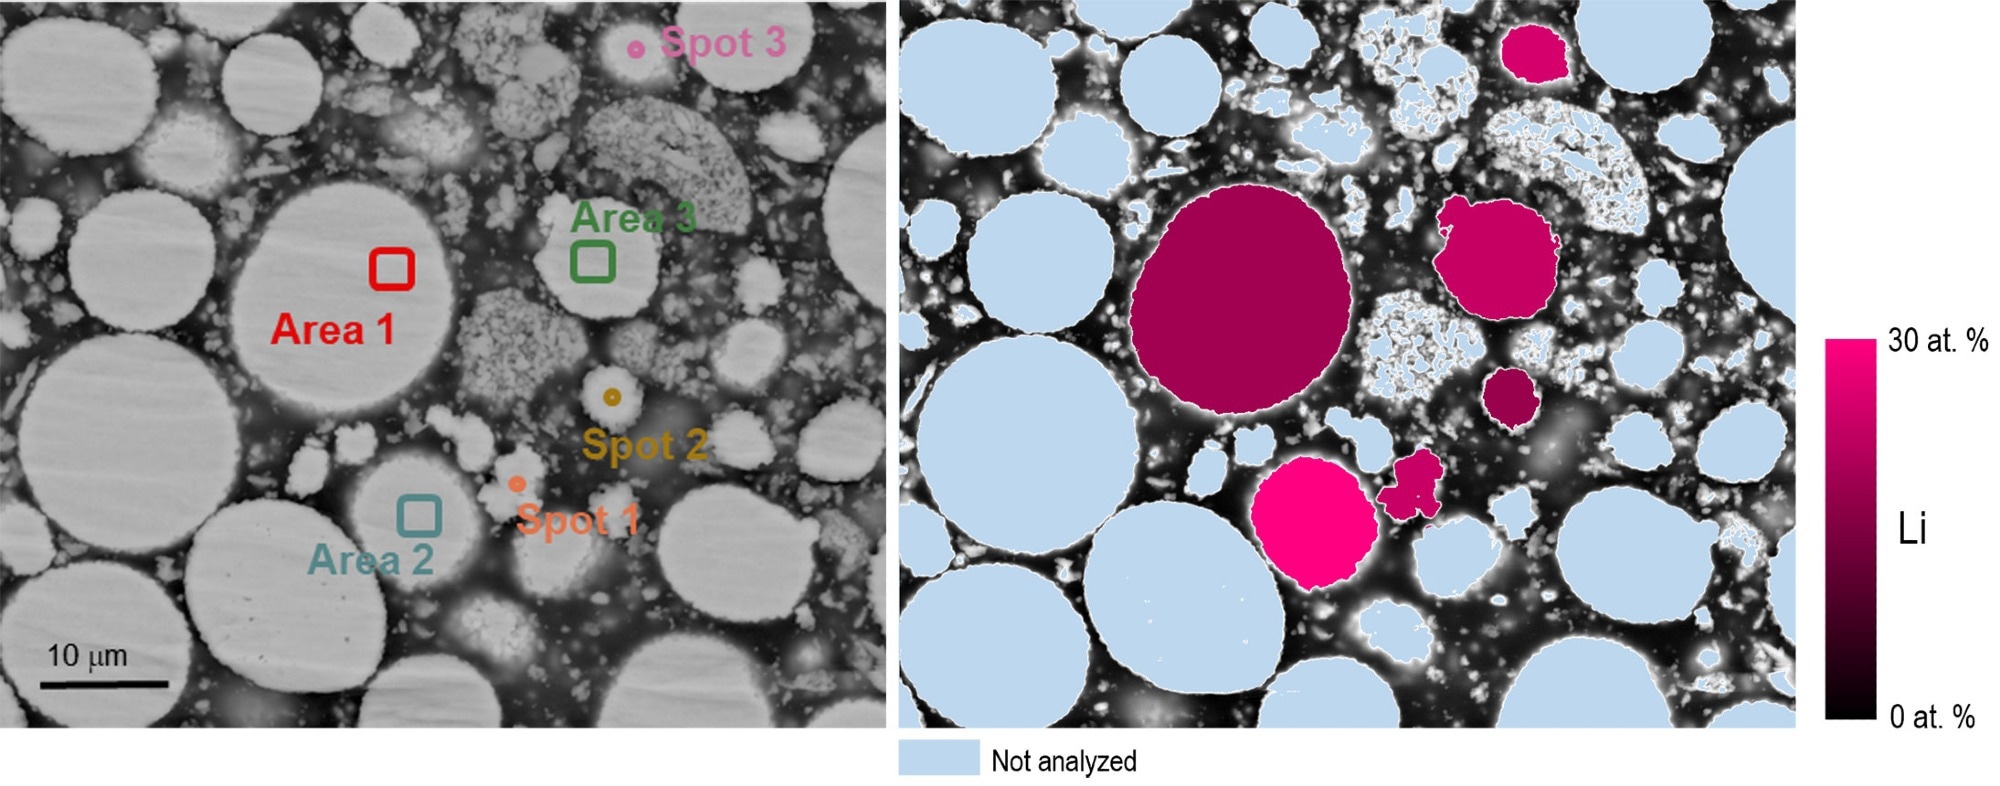
Figure 4. a) A quantitative backscattered electron image where the grayscale intensity value can be related directly to the mean atomic number Z; locations used for quantitative EDS and Li-CDM analysis are indicated. b) A graphical representation of the lithium content of the six NMC particles analyzed using Cipher. Image Credit: EDAX.
This is a major advancement in battery material analysis since the charge status of a cathode material was identified in a typical SEM for the first time. The ~25% Li represents the uncharged status of the battery.
Summary
In stoichiometric chemical samples, the lithium by composition by difference approach was proven. A high-purity lithium aluminate crystal substrate's lithium concentration was found to be 9.5 wt.% within ~ 1 wt.% of the stoichiometric value, a precision comparable to recent results for metallic samples.2
The lithium concentration of an NMC cathode material was quantified for the first time using a standard scanning electron microscope. In this material, a mean lithium concentration of 22.5 at.% was observed experimentally, equivalent to the uncharged battery condition.
These findings verify Li-CDM for a broader spectrum of materials, allowing for intriguing characterization of lithiated battery materials utilizing Cipher.
References
- P. Hovington et al., Scanning 38 (2016) p. 571–578
- R. Gauvin and N. Brodusch, Microsc. Microanal. 28 (Suppl 1), 2022. doi:10.1017/S1431927622002847
- J.A. Österreicher et al., Scripta Materialia 194 (2021) 113664
- Austrian Patent Application A 50783/2020
- J. Donovan et al., (2003) Microsc. Microanal. 9, p. 202. DOI: 10.1017/S143192760030137
- A. Garitagoitia Cid et al., Ultramicroscopy 195 (2018) 47
- https://www.edax.com/-/media/ametekedax/files/eds/ technical_notes/3d%20analysis%20of%20eds%20data.pdf
- D. Kaczmarek, Scanning Microscopy 12 (1) (1998) p. 161-169

This information has been sourced, reviewed and adapted from materials provided by Gatan Inc.
For more information on this source, please visit Gatan Inc.