Some of the most crucial pieces of evidence at a crime scene are bodily fluids, and it is critical that they are identified correctly and analyzed to acquire as much knowledge as possible. Specifically, proper identification of bodily fluid type is vital to enable the correct DNA extraction from the sample.
These fluids are typically found as stains on various substrates under different environmental conditions. Determining the time since deposition (TSD) of a stain can assist with establishing the relevancy of a sample to the crime and verifying the alibis of any individuals involved.¹-³
Bodily fluid identification uses destructive and vague confirmatory and presumptive techniques. There is not one accepted technique for estimating TSD for bodily fluid stains.¹
Therefore, there is a need for rapid, selective, and non-destructive techniques, such as attenuated total-reflection Fourier-transform infrared spectroscopy (ATR FTIR), to be studied and validated for their use in forensic investigation.
ATR FTIR allows the analysis of tiny stains without destroying them, enabling subsequent analysis with complementary techniques.⁴ Analysis of bodily fluid stains using ATR FTIR offers large quantities of data, which makes accurate data processing crucial.
This may be achieved via chemometrics or by applying mathematical and statistical methods to chemical data, as described by Weber and Lednev.¹ In this article, homemade bloodstain reference materials were examined using chemometric methods and ATR FTIR techniques.
Utilizing orthogonal partial-least-square discriminant-analysis (OPLS-DA) models, bloodstains were differentiated by their TSD independently of the substrate on which they were deposited.
Materials and Methods
The stains were created using blood from a single female donor, with samples obtained after pricking one finger with a lancet. The drops of blood were placed on five different substrates: metal, white gauze, plywood, glass, and blue denim (Figure 1).
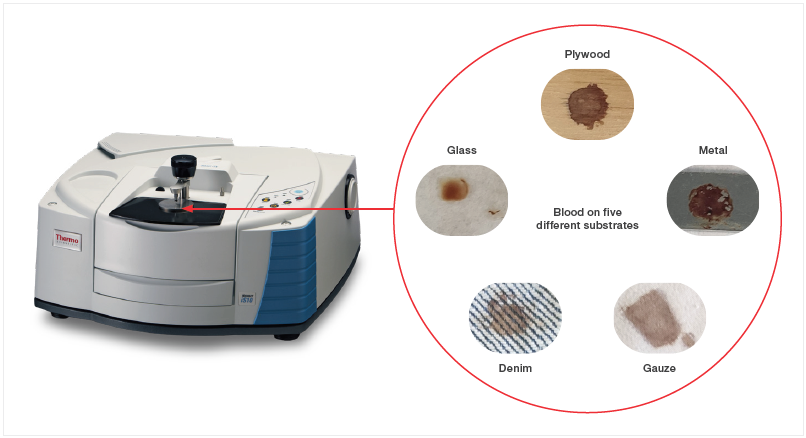
Figure 1. The Nicolet iS10 FTIR Spectrometer with the Smart iTR ATR Accessory is used to analyze blood stains on five substrates: plywood, metal, gauze, denim, and glass. Image Credit: Thermo Fisher Scientific - Elemental Analyzers and Phase Analyzers
These substrates were selected due to their familiar presence in many crime scenes. The samples were left to dry at ambient conditions without any exposure to direct sunlight; humidity and temperature and humidity were uncontrolled.
Each bloodstain was measured after five, 30, and 60 minutes and after one, four, seven, 14, and 28 days. A Thermo Scientific™ Nicolet™ iS10 FTIR Spectrometer was used to perform the analysis.
The apparatus was equipped with the Thermo Scientific™ Smart iTR™ ATR Sampling Accessory (with a diamond crystal component) and Thermo Scientific™ OMNIC™ Software v9.6 (Figure 1). An 8 cm-¹ resolution was used with 32 scans in the 500–4000 cm-¹ range.
The resulting data was fed into The Unscrambler X v10.4 (CAMO-Aspen Technology, Houston, USA) for pre-processing using a standard normal variate (SNV) method to normalize the data. Subsequently, baseline offset correction was applied before Savitzky-Golay smoothing (second-order polynomial with seven smoothing points).
For simple organization, the matrix was input into Microsoft Excel 2008. SIMCA Software v17.02 (Sartorius, Göttingen, Germany) was utilized to create the OPLS-DA models, while OriginPro 2021 (OriginLab Corporation, Northampton, MA, USA) created the graphics.
The OPLS-DA model merges orthogonal signal correction (OSC) and partial least squares (PLS) regression methods. OPLS-DA has a Y-matrix (response matrix) and an X-matrix (descriptor matrix), decomposed into two sections: the orthogonal and the correlated data.
OPLS-DA models can separate predictive and non-predictive variation.⁵ R²X and Q² are two key parameters. The first, R²X, reveals how well the model describes the data, ranging from 0 (the model does not fit the data) to 1 (perfect fit). The second, Q², is the predictive ability of the model, ranging from 0 (no predictive ability) to 1 (perfect prediction).⁶
Results and Discussion
The concentration of the blood’s infrared bands depends on the substrate type it is deposited on. Observing non-porous substrates, the substrate’s characteristic bands were absent in the spectra, and the fluid did not penetrate the inner layers.
However, for porous substrates, the blood penetrated through the inner layers.⁷ In such cases, it may be impossible to identify the blood bands with the naked eye since the substrate’s bands overlap them.
For example, the pure spectra of blood on non-porous glass is compared to that of porous denim (Figure 2), with the characteristic IR bands for blood indicated in gray. Blood is most identifiable in the five-minute spectrum (shown in red) for both substrates.
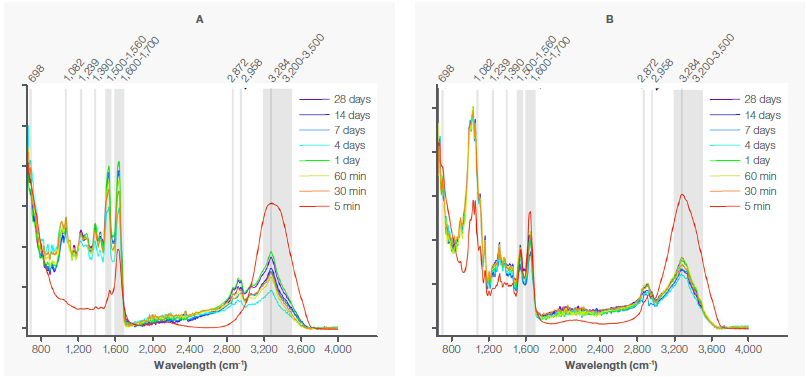
Figure 2. A) Spectra of blood stains deposited on glass, measured for 28 days. B) Spectra of blood stains deposited on denim, measured for 28 days. The characteristic bands of blood are marked in gray. Image Credit: Thermo Fisher Scientific - Elemental Analyzers and Phase Analyzers
Water at 3200–3500 cm-¹ is the most prominent band, which is so substantial that it obscures many other bands, except for the Amide I band at 1600–1700 cm-¹. Since the samples dehydrate over time, the remaining bands become increasingly visible as the water band decreases.
In Figure 2A, the amide bands are visible at 698 cm-¹ (Amide IV), 1239 cm-¹ (Amide III), 1500–1560 cm-¹ (Amide II), 1600–1700 cm-¹ (Amide I), and 3284 cm-¹ (Amide A). The glucose band is positioned at 1082 cm-¹ while the lipid bands are at 1390, 2872, and 2958 cm-¹.
The bands at 3200–3500 cm-¹ result from hydroxyl and water groups. As seen in Figure 2B, the blood bands at 698 cm-¹ (Amide IV), 1082 cm-¹ (glucose), 1239 cm-¹ (Amide III), and 1390 cm-¹ (lipids)⁸,⁹ are concealed by the cellulose bands from the substrate,¹⁰ which dominate the spectra.
The two most complex substrates to measure were metal and gauze. Regarding gauze, the bloodstain is visible on the substrate but cannot instantly be recognized in the spectra. However, the OPLS-DA model can correctly distinguish the substrate with fluid (not shown) from the pure substrate.
Since metal is reflective, spectra with a significant amount of noise were found for the metal substrate, although the characteristic bands of blood were still visible. Over time, the intensity of the bands in the different spectra change, but these changes are frequently visually indistinguishable.
Meanwhile, an OPLS-DA model can classify blood samples by their TSD. The model (Figure 3) has a Q² of 59.4% and an R²X of 96.6%. Each day can be distinguished, although the differentiation between days four (96 hours) and seven (168 hours) is the least well-defined.
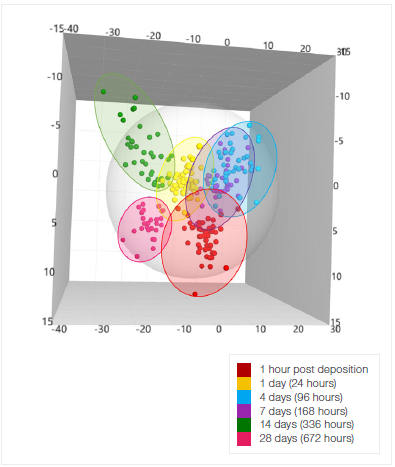
Figure 3. OPLS-DA model that discriminates blood stains by their TSD, independent of substrate. The model was created by measuring blood stains on five different substrates. Image Credit: Thermo Fisher Scientific - Elemental Analyzers and Phase Analyzers
Conclusion
The forensic technique of combined infrared spectroscopy and chemometric modeling shows excellent potential for the approximation of bloodstain TSD.
ATR FTIR spectroscopy can be utilized as a bloodstain monitoring tool due to its ability to identify the characteristic bands of blood, independent of the substrate on which they are deposited. These bands remain detectable irrespective of the time lapsed since the stain was deposited.
Note: The data in this article was compiled using an older model Nicolet iS10 FTIR Spectrometer. Thermo Fisher Scientific now suggests the improved Thermo Scientific Nicolet iS20 FTIR Spectrometer, with enhanced performance and speed compared to its predecessor.
Acknowledgments
Produced from materials originally authored by Cristina Cano-Trujillo, Johana Saldaña, and Fernando E. Ortega-Ojeda, Carmen García-Ruiz and Gemma Montalvo from Alcalá University.
The authors wish to thank the following parties for their funding: European Union’s Horizon 2020 Research and Innovation Programme (No 883116) for the Real-time on-site forensic trace qualification project (RISEN, SU-FCT02-2018-2019-2020-883116), in addition to the University of Alcalá (grant No. 572765/EXP 2022/00185) and the Community of Madrid (No. PEJ-2020-TL/IND-18159).
References
- Weber, AR and Lednev, IK. Crime clock – Analytical studies for approximating time since deposition of bloodstains. Forensic Chem 19(3):100248 (2020)
- Doty, KC, McLaughlin, G, and Lednev, IK. A Raman “spectroscopic clock” for bloodstain age determination: the first week after deposition. Anal Bioanal Chem 408(15):3993-4001 (2016)
- Bremmer, RH, et al. Forensic quest for age determination of bloodstains. Forensic Sci Int 216(1-3):1-11 (2012)
- Zapata, F, et al. Differentiation of Body Fluid Stains on Fabrics Using External Reflection Fourier Transform Infrared Spectroscopy (FT-IR) and Chemometrics. Appl Spectrosc 70(4):654-665 (2016)
- Bylesjö, M, et al. OPLS discriminant analysis: combining the strengths of PLS-DA and SIMCA classification. J Chemometrics 20(8-10):341-351 (2006)
- Ortiz Herrero, L. Development of new methodologies for dating in the forensic field, combining analytical techniques with multivariate regression treatments. Doctoral thesis, University of the Basque Country (2021)
- Quinn, AA and Elkins, KM. The Differentiation of Menstrual from Venous Blood and Other Body Fluids on Various Substrates Using ATR FT‐IR Spectroscopy. J Forensic Sci 62(1):197-204 (2017)
- Mistek-Morabito, E and Lednev, IK. Discrimination between human and animal blood by attenuated total reflection Fourier transform-infrared spectroscopy. Commun Chem 3(1):1-6 (2020)
- Mistek-Morabito, E and Lednev, IK. Discrimination of menstrual and peripheral blood traces using attenuated total reflection Fourier transform-infrared (ATR FT-IR) spectroscopy and chemometrics for forensic purposes. Anal Bioanal Chem 413(9):2513-2522 (2021)
- Silva, TL, et al. Mesoporous activated carbon fibers synthesized from denim fabric waste: Efficient adsorbents for removal of textile dye from aqueous solutions. J Cleaner Prod 171:482-490 (2018)

This information has been sourced, reviewed and adapted from materials provided by Thermo Fisher Scientific - Elemental Analyzers and Phase Analyzers.
For more information on this source, please visit Thermo Fisher Scientific - Elemental Analyzers and Phase Analyzers.