Fourier transform infrared (FTIR) micro-spectroscopy merges infrared (IR) spectroscopy with visualization. As IR spectroscopy offers high specificity for molecular structure and chemical composition, FTIR micro-spectroscopy is valuable when examining the spatial distribution of chemical substances.
FTIR micro-spectroscopy typically encompasses the mid-infrared (mid-IR) spectrum, which spans from 4,000 to 400 cm-1 in wavenumber or approximately 2,500 to 25,000 nm in wavelength. Absorptions within the mid-IR correspond to the fundamental vibrations of chemical bonds linked to the atoms within molecules.
The characteristic frequencies of mid-IR absorptions in various vibrational bands simplify band assignment and interpretation. However, mid-IR often necessitates thin samples and more elaborate sample preparation.
In contrast, near-infrared (NIR) absorptions result from overtones and combinations of fundamental vibrations, occurring in the range of 12,500 to 4,000 cm-1 in wavenumbers or wavelengths ranging from 800 to 2,500 nm.
Overtones and combination bands in NIR inherently possess lower molar absorptivities, resulting in increased sample penetration depth. As a result, NIR spectra are easily obtained with minimal sample preparation.
Moreover, NIR radiation can pass through various materials, such as glass or transparent plastics, enabling spectral collection in containers like blister packs.
The Thermo Scientific™ Nicolet™ RaptIR+™ FTIR Microscope leverages these characteristics of NIR radiation. The RaptIR+ offers the flexibility to interchange detectors from a mid-IR MCT detector to an InGaAs NIR detector.
The software offers a one-click option for running an automated routine to optimize the detector. When used in conjunction with the Thermo Scientific™ Nicolet™ iS50 FTIR Spectrometer, the RaptIR+ FTIR microscope allows for effortless switching of the excitation source to a white light source and the beamsplitter to a CaF2 beamsplitter.
As a result, a mid-IR microscope can transform into an NIR microscope within minutes. This technical note presents various practical applications of the Thermo Scientific Nicolet RaptIR+ FTIR Microscope, showcasing the benefits of NIR microscopy through the use of its user-swappable InGaAs detectors.

Nicolet RaptIR+ FTIR Microscope. Image Credit: Thermo Fisher Scientific – Materials & Structural Analysis
Results
Figure 1 displays visual images (left) and representative NIR spectra (right) of a caffeine tablet in blister packaging alongside FTIR correlation images. The spectra are labeled as caffeine (a) and corn starch (b). Corn starch serves as the primary excipient in this tablet.
The correlation images (inserts) derived from the NIR spectra reveal the spatial distribution of these two components. In this case, the tablet was analyzed without any prior sample preparation.
Due to the translucent nature of the outer plastic packaging, it allows for direct focusing on the tablet surface. The packaging is thin enough that the NIR absorbances of the plastic are minimal and do not disrupt the tablet analysis.
Affordable materials like glass and quartz are NIR transparent, eliminating the necessity for specialized window materials like KBr and BaF2, which are needed for mid-IR measurements. Typically, samples require specific preparation for mid-IR analysis, whereas NIR is more forgiving.
Figure 2 illustrates a honeybee wing prepared for visual microscopy. The wing is sandwiched between a glass microscope slide and a glass coverslip, with an adhesive used to prevent disassembly for IR microscopy analysis.
Nevertheless, NIR can capture spectral data through the glass. The materials used in mounting contribute to the spectral features, but these contributions can be subtracted to obtain a spectrum resembling chitin, a major component in bee wings.
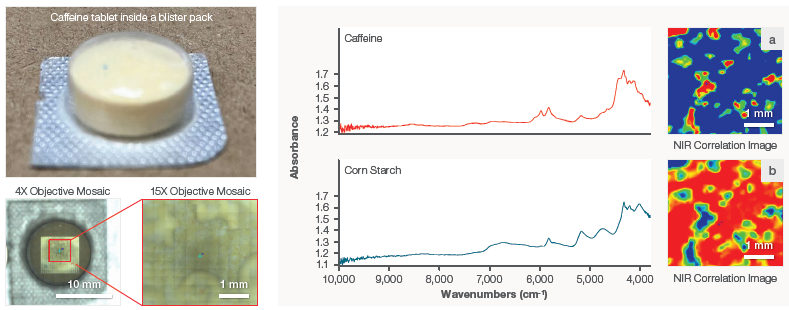
Figure 1. Left: Visual images of a caffeine tablet inside a blister pack. Right: Representative NIR spectra (through the blister pack) and correlation images showing the spatial distribution of (a) caffeine and (b) corn starch. The red areas on the images indicate high correlation with the spectra of the material specified and blue areas indicate an extremely low contribution. Image Credit: Thermo Fisher Scientific – Materials & Structural Analysis

Figure 2. Visual Images of the mounted honeybee wings. The wings are mounted on a glass microscope slide with a glass cover slip secured on top of the wings with an adhesive. A NIR image of the wing is shown as well as a spectrum of the wing material. The contributions of the mounting material were subtracted off to give a spectrum of the honeybee wing which can be compared to a NIR spectrum of chitin from a different source. Image Credit: Thermo Fisher Scientific – Materials & Structural Analysis
FTIR spectroscopy and micro-spectroscopy have found extensive application in the study of microplastics (MPs). These techniques help characterize the types of polymers and track the movement and distribution of these MPs in various environmental settings. [https://www.tandfonline.com/doi/full/10.1080/10643389.2020.1807450].
In the identification of larger MPs (>200–300 µm), Attenuated Total Reflection (ATR)-FTIR is commonly used. On the other hand, smaller MPs (down to 20 µm) are analyzed using FTIR microscopy, often mid-IR microscopy.
However, there exists a challenge with particles in the size range of 100-500 µm. They can be too small for convenient ATR measurements yet too substantial or thick for mid-IR transmission microscopy. As an example, Figure 3 displays the visual image, chemical image, and FTIR spectrum of a polyester particle, approximately 400 µm in size.
These particles cause issues due to their strong absorption peaks, leading to the loss of a substantial amount of mid-IR spectral details. Figure 3 highlights another common challenge encountered in MP analysis using FTIR microscopy.
In this case, the filter material, Al2O3, exhibits strong absorption in the fingerprint region, which blocks spectral features from polyester and results in further loss of information. The options for mid-IR transparent filter materials are still limited.

Figure 3. Mid-IR analysis of the polyester particle. Significant loss of spectral details of polyester due to over-absorbing peaks and the interference of the Al2O3 filter. Image Credit: Thermo Fisher Scientific – Materials & Structural Analysis
Figure 4 reveals the NIR microscopy analysis of five different microplastic (MP) particles, varying in size from 100-500 µm. All the NIR spectra (at the bottom) show well-defined spectral characteristics, regardless of the particle size. This is due to the relatively weak absorptions inherent to NIR.
These spectra also do not encounter interference from the filter material, Al2O3. When appropriate NIR libraries are accessible, NIR microscopy could serve as a feasible alternative to mid-IR for analyzing large microplastic particles.
Reflectance measurements play a significant role in FTIR microscopy experiments because transmission measurements require thin specimens or small sample amounts dispersed in non-absorbing matrices.
Reflectance represents the combined effect of two types of reflection: specular reflection, where light bounces off the surface, and diffuse reflection, where light scatters after penetrating the sample.
The proportions of specular and diffuse reflection depend on the absorptivity and particle sizes of the sample, as well as the wavelength. Smaller particle sizes and weak absorption promote diffuse reflection.

Figure 4. Top: (a) Visual mosaic image of the 5 microplastic particles. (b) MCR (multivariate curve resolution) NIR image of the 5 microplastic particles. The colors indicate the different types of polymers. Bottom: Representative NIR spectra from the 5 microplastic particles. Image Credit: Thermo Fisher Scientific – Materials & Structural Analysis
Figure 5 depicts visual images of a pharmaceutical tablet captured using 4x (a) and 15x (b) objectives. This tablet contains three active ingredients: aspirin, acetaminophen, and caffeine, along with the excipient cellulose.
In Figures 6 and 7, you can see correlation images at the top and spectra at the bottom of the tablet using mid-IR and NIR microscopy.
Concerning the correlation images, mid-IR and NIR microscopy yield similar results, although the mid-IR correlation images may appear a bit grainier, particularly for high-concentration components like acetaminophen and aspirin.
The appearance of reflection spectra depends on the balance between specular reflection and diffuse reflection. Specular reflection is influenced by the refractive index, which reaches a minimum on the high wavenumber side of an absorption band and a maximum on the low wavenumber side.
As a result, the mid-IR specular reflection spectrum resembles a first derivative. Since absorption in NIR is weaker than in mid-IR, there are minor variations in the refractive index, leading to minimal specular reflection in NIR.
Diffuse reflection, on the other hand, results from scattered or reflected light at various angles as the incident light enters the sample.
As the incident light traverses through the sample, some are absorbed, which is why the diffuse reflection spectra resemble transmission spectra. In mid-IR, strong bands in diffuse reflection can become completely absorbing. In NIR, due to weaker absorbance, scattering is more efficient.

Figure 5. Visual Mosaic Images of a Migraine Relief Tablet. (a) Mosaic of the whole tablet using the 4x objective. (b) Mosaic image of the area of interest using the 15x objective. Image Credit: Thermo Fisher Scientific – Materials & Structural Analysis


Figure 6. Top: Mid-IR correlation images of a pharmaceutical tablet. The images show the spatial distribution of the tablet components based on the Mid-IR spectra. The red areas indicate high correlation with the spectra of the material specified and blue areas indicate an extremely low contribution. Bottom: Representative spectra from the Mid-IR analysis of the tablet area. Image Credit: Thermo Fisher Scientific – Materials & Structural Analysis


Figure 7. Top: NIR correlation images showing the spatial distribution of tablet components within the area of interest. The red areas indicate high correlation with the spectra of the material specified and blue areas indicate an extremely low contribution. Bottom: Representative NIR spectra from the various components. Image Credit: Thermo Fisher Scientific – Materials & Structural Analysis
In summary, a reflection spectrum always comprises contributions from both specular and diffuse reflections. In mid-IR, specular reflection dominates, resulting in a peak shape resembling a derivative (Figure 6). Conversely, in NIR, diffuse reflection prevails, giving rise to a peak shape resembling transmission (Figure 7).
To transform specular reflection spectra into absorption-type spectra, a mathematical operation called Kramers-Kronig (K-K) transformation is commonly applied. However, it's important to note that this conversion can distort any features associated with diffuse reflectance.
It is also important to note that specular reflection can vary from one particle to another within the sample.
This explains the slightly grainier appearance of the correlation images in Figure 6 (top). In cases where the components are known and a suitable library is accessible, like the current situation, NIR microscopy may be the preferred method.
Summary
The Thermo Scientific Nicolet RaptIR+ FTIR Microscope introduces enhanced analytical capabilities in the NIR region through user-swappable InGaAs detectors. This tech note demonstrates the distinct advantages of NIR microscopy:
1. Glass's transparency in the NIR region enables the direct analysis of a bee wing sample prepared using glass materials, which are not suitable for mid-IR analysis. 2. A tablet was effectively mapped by directly focusing on its surface through a blister package. Minimal influence from the packaging material was noticed, primarily because of its low NIR absorptivity. This demonstrates a sampling advantage offered by NIR when compared to mid-IR analysis.
3. When dealing with the analysis of microplastic particles in the 100-500 μm range, where sample preparation is cumbersome, mid-IR transmission measurements result in excessive absorption. NIR microscopy provides a practical solution due to its relatively weaker absorption in the NIR range.
4. Reflection measurements enable the acquisition of spectra from a diverse array of sample types. The enhanced scattering, particularly diffuse reflection, in the NIR region produces spectra reminiscent of transmission. This enables direct library searches and enhances correlation imaging.

This information has been sourced, reviewed and adapted from materials provided by Thermo Fisher Scientific – Materials & Structural Analysis.
For more information on this source, please visit Thermo Fisher Scientific – Materials & Structural Analysis.