NMR spectroscopy is an analytical technique commonly used in academia and industry, and is a critical part of today’s food, chemistry, biochemistry, and pharmaceuticals research.
NMR facilitates the high-speed identification of most organic substances by establishing their chemical structure and can frequently measure the quantity of a particular substance in samples. Benchtop NMR spectrometers utilize permanent magnets as an alternative to the cryogen-cooled superconducting magnets used in high-field NMR.
Consequently, they are much more compact, simpler to maintain, less expensive to operate, and can take over routine work formerly carried out utilizing high-field NMR instruments or complementary analytical techniques (e.g. FT-IR, GC-MS, NIR, and various chromatography techniques).
Instruments may be placed in a test facility or laboratory and relocated to different factory locations on a trolley. This makes benchtop NMR spectroscopy ideal for quality control of raw materials, in-line process monitoring, and final product Quality Assurance (QA).

Image Credit: Oxford Instruments Magnetic Resonance
Screening Applications of Benchtop NMR
The majority of analytical work on benchtop NMR spectrometers utilizes just the proton (1H) spectrum, but benchtop instruments are proficient in obtaining spectra from other NMR-sensitive nuclei, including lithium (7Li), carbon (13C), boron (11B), fluorine (19F), silicon (29Si), phosphorus ( 31P), and many others.
The Oxford Instruments X-Pulse instrument provides a broadband option where a wide range of NMR-sensitive nuclei can be accessed on one instrument.
Benchtop NMR spectrometers usually best detect molecules or compounds with a molar mass of around 600 g/mol or less. Within this range, the peaks in the spectra can be measured by lower dispersion benchtop systems.
A popular application for benchtop NMR is rapid sample screening to verify molecular structure after a chemical synthesis. This offers a QA tool to test the identity and quality of incoming raw materials.
They can quickly test a significant number of samples to observe whether the expected peaks are present in the spectrum before giving the samples to high-field systems for more comprehensive analysis.
This saves substantial time for chemists carrying out the syntheses and ensures that the costly high-field instruments are utilized most efficiently.
Case study examples are now presented of QA screening from chemical suppliers to the industries of (1) plastics and construction, (2) fluoropolymers, and (3) lithium-ion batteries.
Raw Materials Checking: Fiberglass Sizing Compounds
In this example, a company producing fiberglass had concerns regarding the quality of incoming chemicals utilized for glass fiber sizing. Using an Oxford Instruments X-Pulse instrument, they tested three samples, each provided by two suppliers.
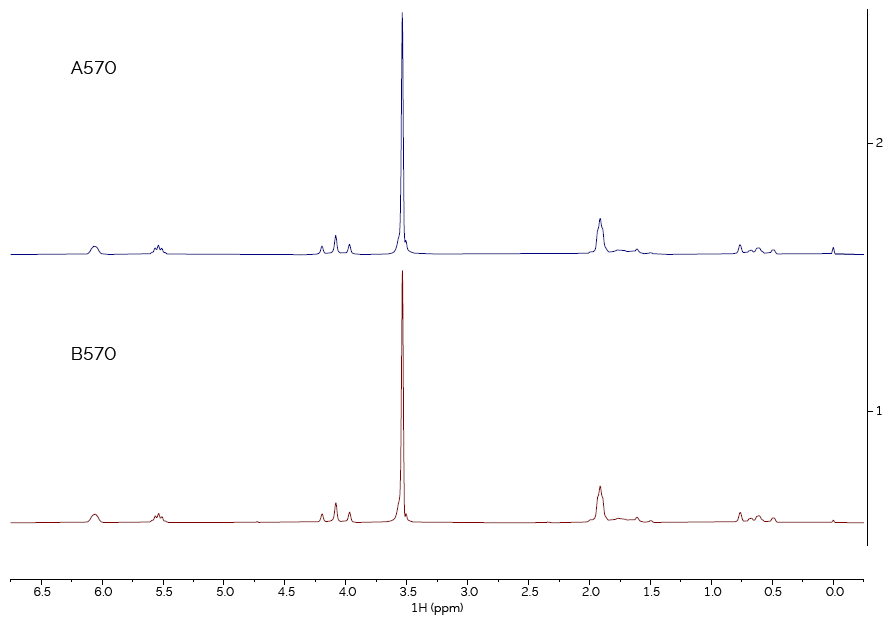
Figure 1. Comparison of spectra of sample type 570, from suppliers A and B. Image Credit: Oxford Instruments Magnetic Resonance
Samples were compared from both suppliers that were thought to be the same material. First, sample type 570 (as shown in Figure 1). The two spectra are identical, confirming that the materials from Supplier A and Supplier B are the same chemical.
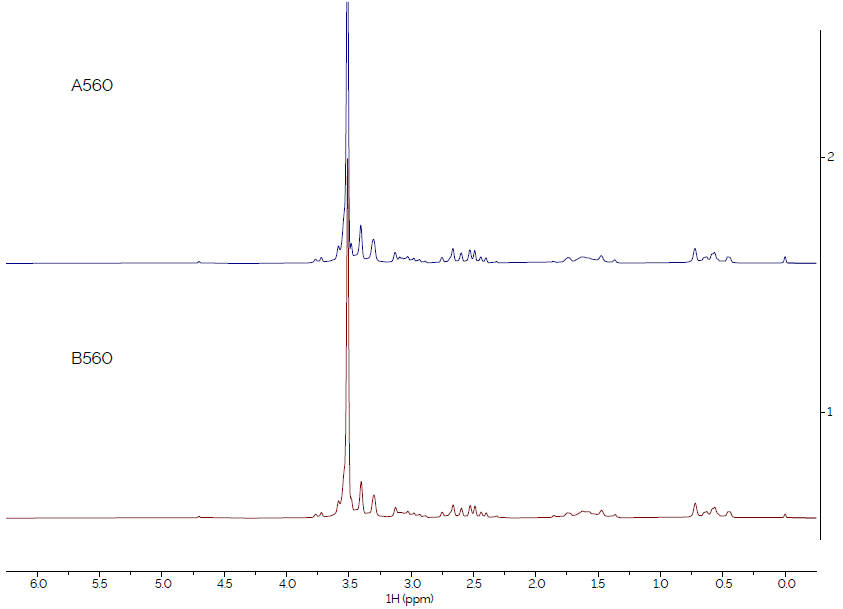
Figure 2. Comparison of spectra of sample type 560, from suppliers A and B. Image Credit: Oxford Instruments Magnetic Resonance
Similarly, the spectra from sample type 560, as shown in Figure 2, are identical, confirming that the materials from Supplier A and Supplier B are the same.
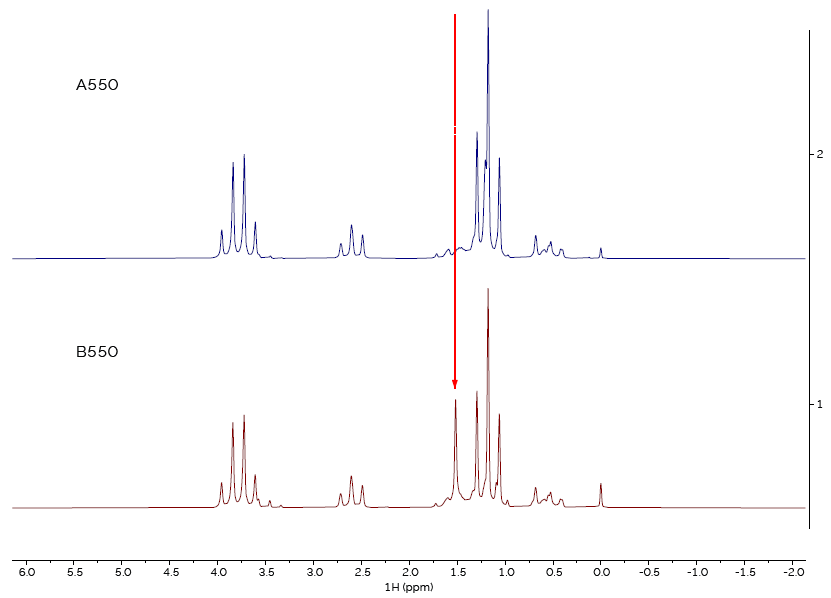
Figure 3. Comparison of spectra of sample type 550, from suppliers A and B. Image Credit: Oxford Instruments Magnetic Resonance
However, when comparing the spectra from sample type 550 (Figure 3), it is clear that the spectra are not the same, demonstrating that the material from one of the two suppliers is not the correct material.
Raw Materials Checking: Fluorinated Chemical Feedstocks
In this example, a chemical manufacturer obtained a feedstock chemical from two separate suppliers and discovered that only one of them worked in their reaction. This cost the company a considerable amount of time and money. They wanted to confirm whether the cause was due to contamination, degradation, or another factor.
The feedstock chemical was 2,3-dichloro-1,1,1-trifluoropropane, a relatively simple molecule that produces a complex 1H NMR spectrum, considering it only has three hydrogen atoms.
First, the 1H spectrum of a reference sample of this material was observed and compared to the spectrum of the “failed” material. Figure 4 presents the two spectra.
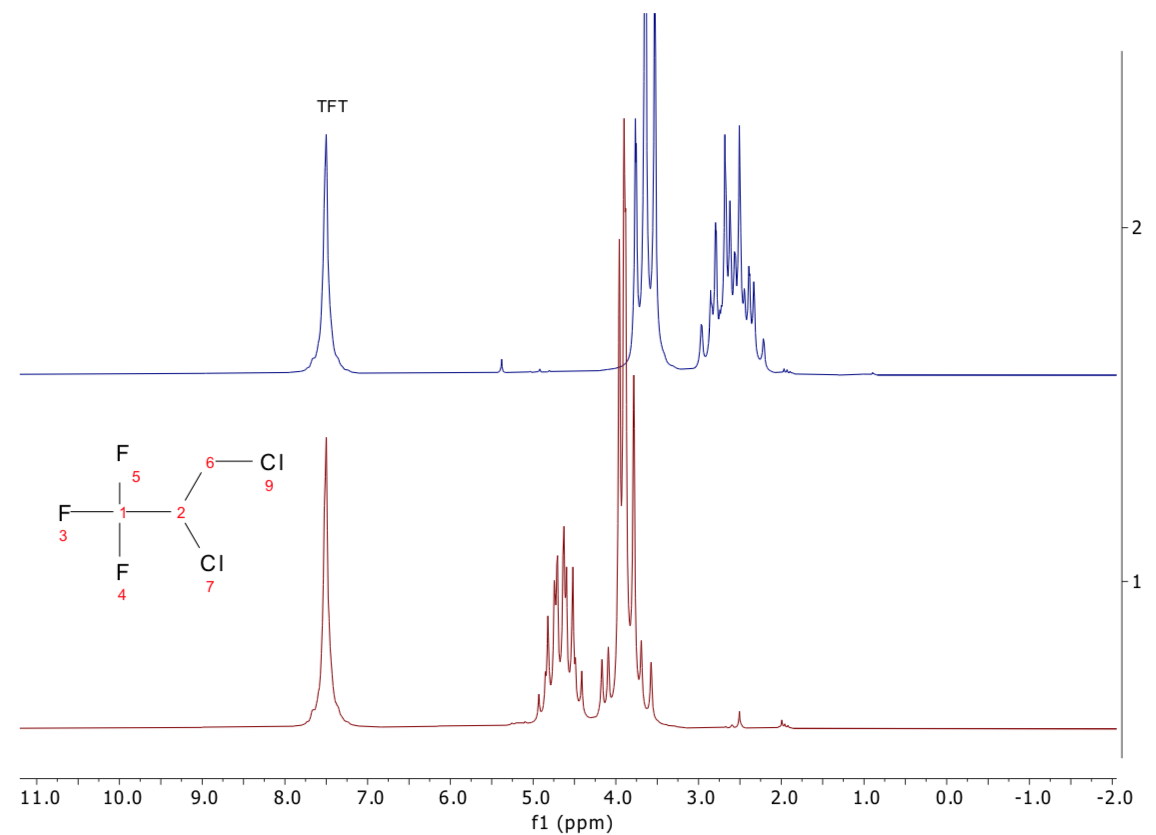
Figure 4. 1H 1D NMR spectra of 2,3-dichloro-1,1,1-trifluoropropane (bottom, red) and the unknown sample (top, blue). Image Credit: Oxford Instruments Magnetic Resonance
There are significant differences between the two spectra, verifying immediately that this supplier’s feedstock is chemically different from what was claimed, causing the failure in the reaction.
To confirm this conclusion, we then looked at the 19F spectra, which are extremely straightforward to interpret and again saw substantial differences between them, as shown in Figure 5.
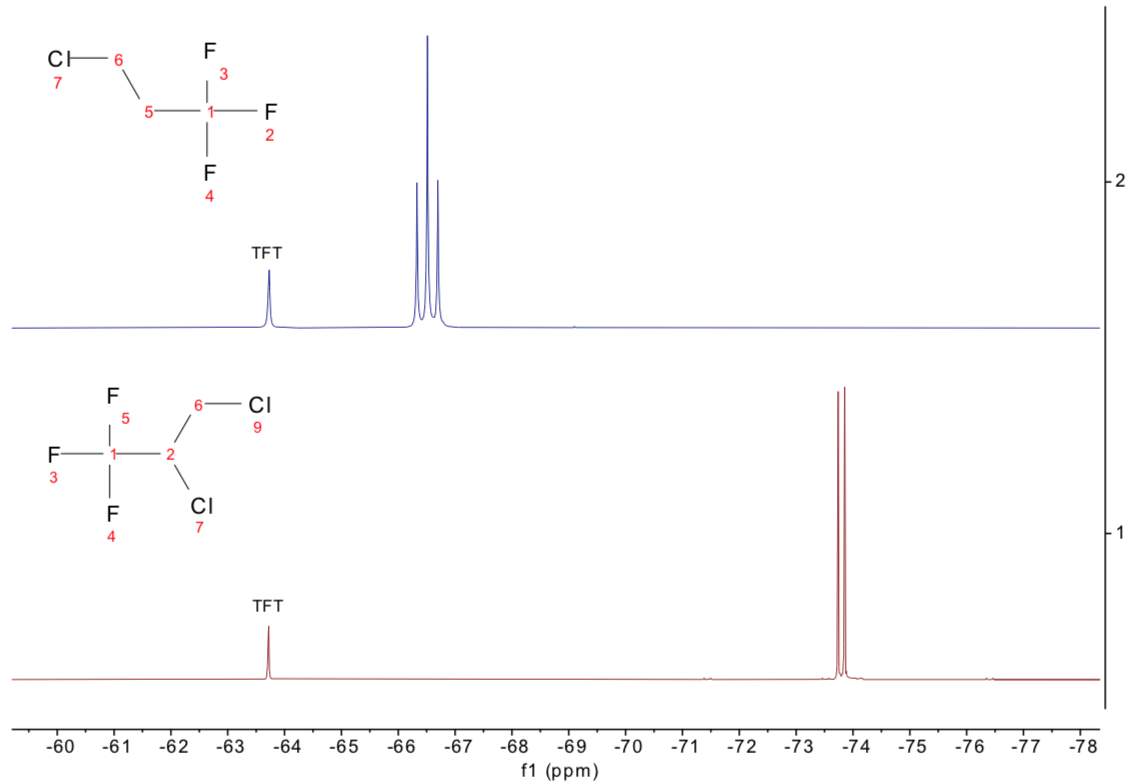
Figure 5. 19F 1D NMR spectra of 2,3-dichloro-1,1,1-trifluoropropane (bottom, red) and the unknown sample (top, blue), now assigned as 3-chloro-1,1,1-trifluoropropane. Image Credit: Oxford Instruments Magnetic Resonance
By observing the 13C spectra (not displayed here), the “failed” material was identified as 3-chloro-1,1,1-trifluoropropane, not 2,3-dichloro-1,1,1-trifluoropropane, and was mislabeled.
Since the full structural determination is not required to screen a compound, either the 19F or the 1H spectra alone can deliver the yes/no QA answer. Both may be obtained in approximately one minute, allowing a fast and high throughput checking process, when required.
Final Product Checking: Electrolytes for Lithium Ion Batteries
In this final case study, a chemical manufacturer acquired two different batches of their final product, a standard battery electrolyte of lithium hexafluorophosphate (Li[PF6]) in a blend of two carbonated solvents, ethylene carbonate (EC), and ethyl methyl carbonate (EMC).
Although to the naked eye the two batches (B1 and B2) seemed identical, it was discovered that batch B2 held significantly different performance characteristics to those expected when placed inside a battery cell.
Firstly, the 1H spectra of both compounds were collected. The spectra display all expected peaks for the 1H nuclei in both solvents, as shown in Figure 6. Visually, they appear to be identical.
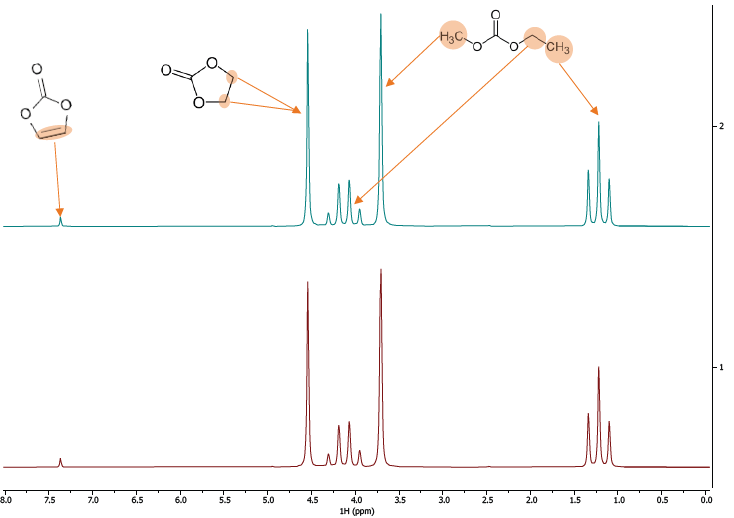
Figure 6. 1H Spectra of two different batches of LiPH6 in EMC/EC. Image Credit: Oxford Instruments Magnetic Resonance
Similar to the previous example, the subsequent test was to measure the 19F spectrum. In these samples, this specifically probes the Li-salt and identifies if the source of the performance difference can be revealed there. The distinction is immediately visible in comparison with the spectra in Figure 7.
In sample B2, the expected doublet from the PF is accompanied by a second doublet. This doublet is highly likely to correspond to OPF2(OH), a normal breakdown product of Li[PF6] when exposed to water in the presence of carbonated solvents.
This establishes the cause of the difference in performance between the two electrolytes.
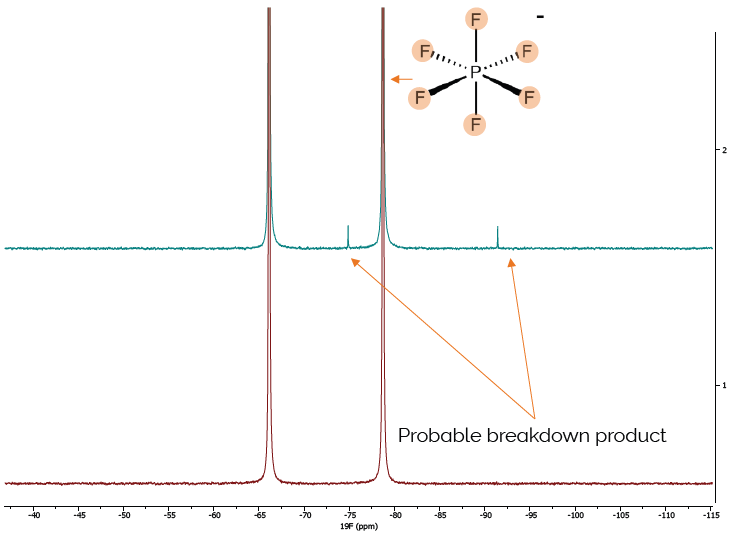
Figure 7. 19F Spectra of two different batches of LiPH6 in EMC/EC, extra peaks in sample B2 clearly show the failed sample. Image Credit: Oxford Instruments Magnetic Resonance
Conclusions
In the case studies presented, similarities and differences in the “good” and “bad” spectra may be observed with the naked eye without prior knowledge of the compounds’ chemical structure.
This allows “Go - No Go” test approaches for incoming raw materials that may be formalized with spectral pattern matching to reference databases.
For numerous QA/QC and raw materials screening applications (particularly for low molecular weight molecules), contemporary benchtop NMR spectrometers now offer a quicker, more convenient, low-cost solution.
They can complement or replace analytical methods, including FT-IR, GC-MS, chromatography, and more complex, costly high-field NMR instruments. Their simplicity and speed create substantial time and cost savings for low-volume and high-throughput uses.
Image Credit: Oxford Instruments Magnetic Resonance
X-Pulse is a high-resolution benchtop NMR spectrometer. Utilizing a high stability 60 MHz (1.4T) permanent magnet, X-Pulse allows users to collect NMR data without requiring specialist facilities or liquid cryogens. X-Pulse has been optimized with unique shimming technology to deliver a resolution of better than 0.35 Hz.
For convenience, X-Pulse utilizes standard 5 mm NMR tubes needing only 300 μL of the sample. X-Pulse is the first benchtop NMR system to include a broadband X-Nuclei channel enabling users to choose the appropriate nucleus for their application, including lithium, phosphorous, carbon, boron, silicon, and many more.
X-Pulse is operated by the user-friendly spinflow software interface. This software permits users to control each part of the instrument. For quality control applications like those described above, specific experiments may be saved and run with a single mouse click to guarantee repeatability and consistency between measurements.

This information has been sourced, reviewed and adapted from materials provided by Oxford Instruments Magnetic Resonance.
For more information on this source, please visit Oxford Instruments Magnetic Resonance.