Sponsored by PerkinElmerReviewed by Olivia FrostMay 5 2023
The polymer backsheet of a photovoltaic (PV) module plays a crucial part in the maintenance of the general integrity of the system. As the last layer at the rear of the PV module (as shown in Figure 1), the backsheet typically consists of a multilayer polymer structure that may be coextruded or laminated.1
A typical three-layered structure of a backsheet is comprised of an outer layer with ideal properties to resist environmental stress, a middle layer for good electrical insulation, and an inner layer with good adhesive properties.
Polyethylene terephthalate (PET) is a popular choice of PV backsheet material for internal and external layers of the composite. However, there are some disadvantages to using PET as an environmentally resistant external layer compared to more resilient fluoropolymers, including polyvinyl fluoride (PVF).2
Degradation modes such as hydrolysis cause a loss of molar mass in PET that may be quantified via Gel Permeation Chromatography (GPC).3
Another method to be considered for testing PET degradation by hydrolysis is Differential Scanning Calorimetry. This delivers valuable information concerning the thermal characteristics of polymers.
This article presents the results achieved via GPC for the molar mass of PET samples compared to the crystallization temperatures of the same samples collected using a PerkinElmer DSC 4000.
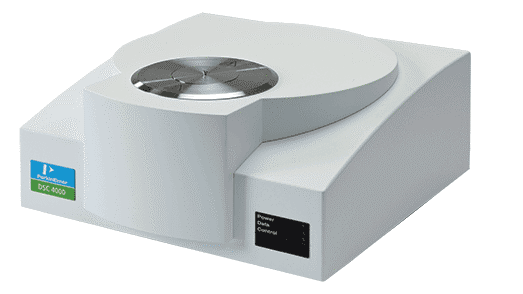
PerkinElmer DSC 4000. Image Credit: PerkinElmer
Background
PET is a thermoplastic polymer utilized in various industries and applications. A well-renowned disadvantage of PET is its inclination to experience a process of hydrolysis degradation when subjected to temperatures beyond its glass transition temperature (approximately 80 °C) and elevated humidity.2
Hydrolysis results in the PET degrading substantially, causing a loss of thermal, mechanical, and rheological properties characterized by overall embrittlement due to polymer chain scission.
Hydrolysis of PET causes the polymer chain of PET to be shorter, leading to an overall decline of the polymer’s molar mass. This degradation can cause the breaking apart of the backsheet material, which results in a considerable reduction of functionality and electrical insulation in the PV module.3
Any embrittled polymer can instantly break off from the PV module and enter the environment as microplastic waste. The subsequent loss of molar mass in the degraded PET is frequently quantified via Gel Permeation Chromatography (GPC).
Although the GPC technique is appropriate for quantifying the molar mass of PET, it is time-consuming and involves using toxic solvents, e.g. chloroform and hexafluoroisopropanol.4
DSC may be utilized to characterize a polymer's chemical (irreversible) aging and physical (reversible) aging by observing the results of the first cooling and heating curves, respectively.
A PerkinElmer DSC 4000 was employed to determine the crystallization temperatures of PET samples prepared by aging at rising temperatures and humidity to trigger degradation.
The DSC data offers valuable insight into the chemical and physical degradation of the PET but also demonstrates an interesting relationship when compared to the molar mass data gained from GPC analysis.
A linear correlation exists between the increasing crystallization temperature of degraded PET and the corresponding decrease in molar mass for the same samples measured by GPC.
This data allows for a more rapid method of determining if a sample of PET backsheet has experienced a loss of molar mass caused by degradation such as hydrolysis.
With more data concerning the long-term stability of a polymer under environmental conditions, its appropriateness as a backsheet material can be characterized with elevated accuracy.
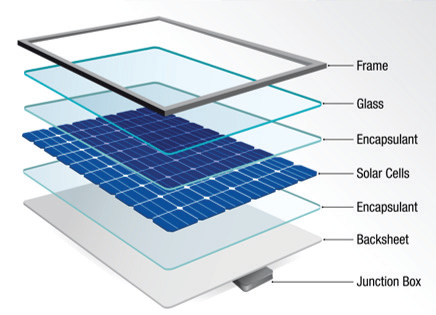
Figure 1. Schematic of a PV module. Image Credit: PerkinElmer
Experimental
A commercially available PET film (50 µm thick, transparent, triple-layer, coextruded, and biaxially drawn) was utilized as the foundation for the experimental procedure. This PET sample was exposed to two sets of aging conditions.
The first set of conditions involved exposing the PET sample to elevated temperatures in an oven at the temperature intervals detailed in Table 1. The second set of conditions consisted of exposing the PET sample to elevated temperatures at a constant relative humidity (RH) in a climate chamber as detailed in Table 2.
Table 1. Thermal aging parameters. Source: PerkinElmer
| Oven Sample Set |
Oven Temperature |
| 1 |
65 °C |
| 2 |
85 °C |
| 3 |
95 °C |
| 4 |
125 °C |
Table 2. Climate aging parameters. Source: PerkinElmer
| Climate Chamber Sample Set |
Climate Chamber Conditions |
| 1 |
65 °C, 85% RH |
| 2 |
85 °C, 85% RH |
| 3 |
95 °C, 85% RH |
The samples were subjected to the corresponding aging conditions for 1000, 2000, and 3000 hours for both tests. DSC analyzed the aged and unaged samples to assess and characterize the effect of aging the PET film under experimental conditions.
Instrumentation
1. DSC
DSC is a method of thermal analysis that analyses how the heat flow characteristics of a sample change as the temperature changes. These changes in heat flow are tracked as endothermic and exothermic processes occur.
DSC enables the characterization of phase changes, including crystallization, melting, glass transitions, and curing, without requiring time-consuming sample preparation.5 A PerkinElmer DSC 4000 was employed to characterize the thermal behavior of both aged and unaged PET.
The DSC experimental parameters are detailed in Table 3. The PET samples were cooled between heating runs to identify any possible reversible and irreversible processes.
Table 3. DSC Experimental parameters. Source: PerkinElmer
| . |
. |
| Temperature program |
23 °C – 270 °C @ 10 °C /min |
| Sample weight |
Approx. 10 mg |
| Purge gas |
Nitrogen |
| Sample pans |
Aluminium, 50 μL volume, Perforated lid (Part number: N5190788) |
2. GPC
GPC was performed for the quantification of changes in the molar mass of the PET due to aging the samples under experimental conditions. Further information regarding the details of the GPC method can be found in Reference 4.
Results and Discussion
The adjustments to the crystallization and melting temperatures observed in the DSC data of the PET samples at lower temperatures were reasonably small. A minor increase in melting temperatures was observed, indicative of possible post-crystallization in PET aged at higher temperatures.3
The most evident changes were observed in the cooling data of the DSC, particularly of the samples aged at temperatures over the PET glass transition temperature of 85 °C 85% RH, and even further at 95 °C 85% RH.
Figure 2 displays a plot of crystallization temperatures versus aging time, demonstrating very little change for the samples aged without humidity or in the oven at lower temperatures.
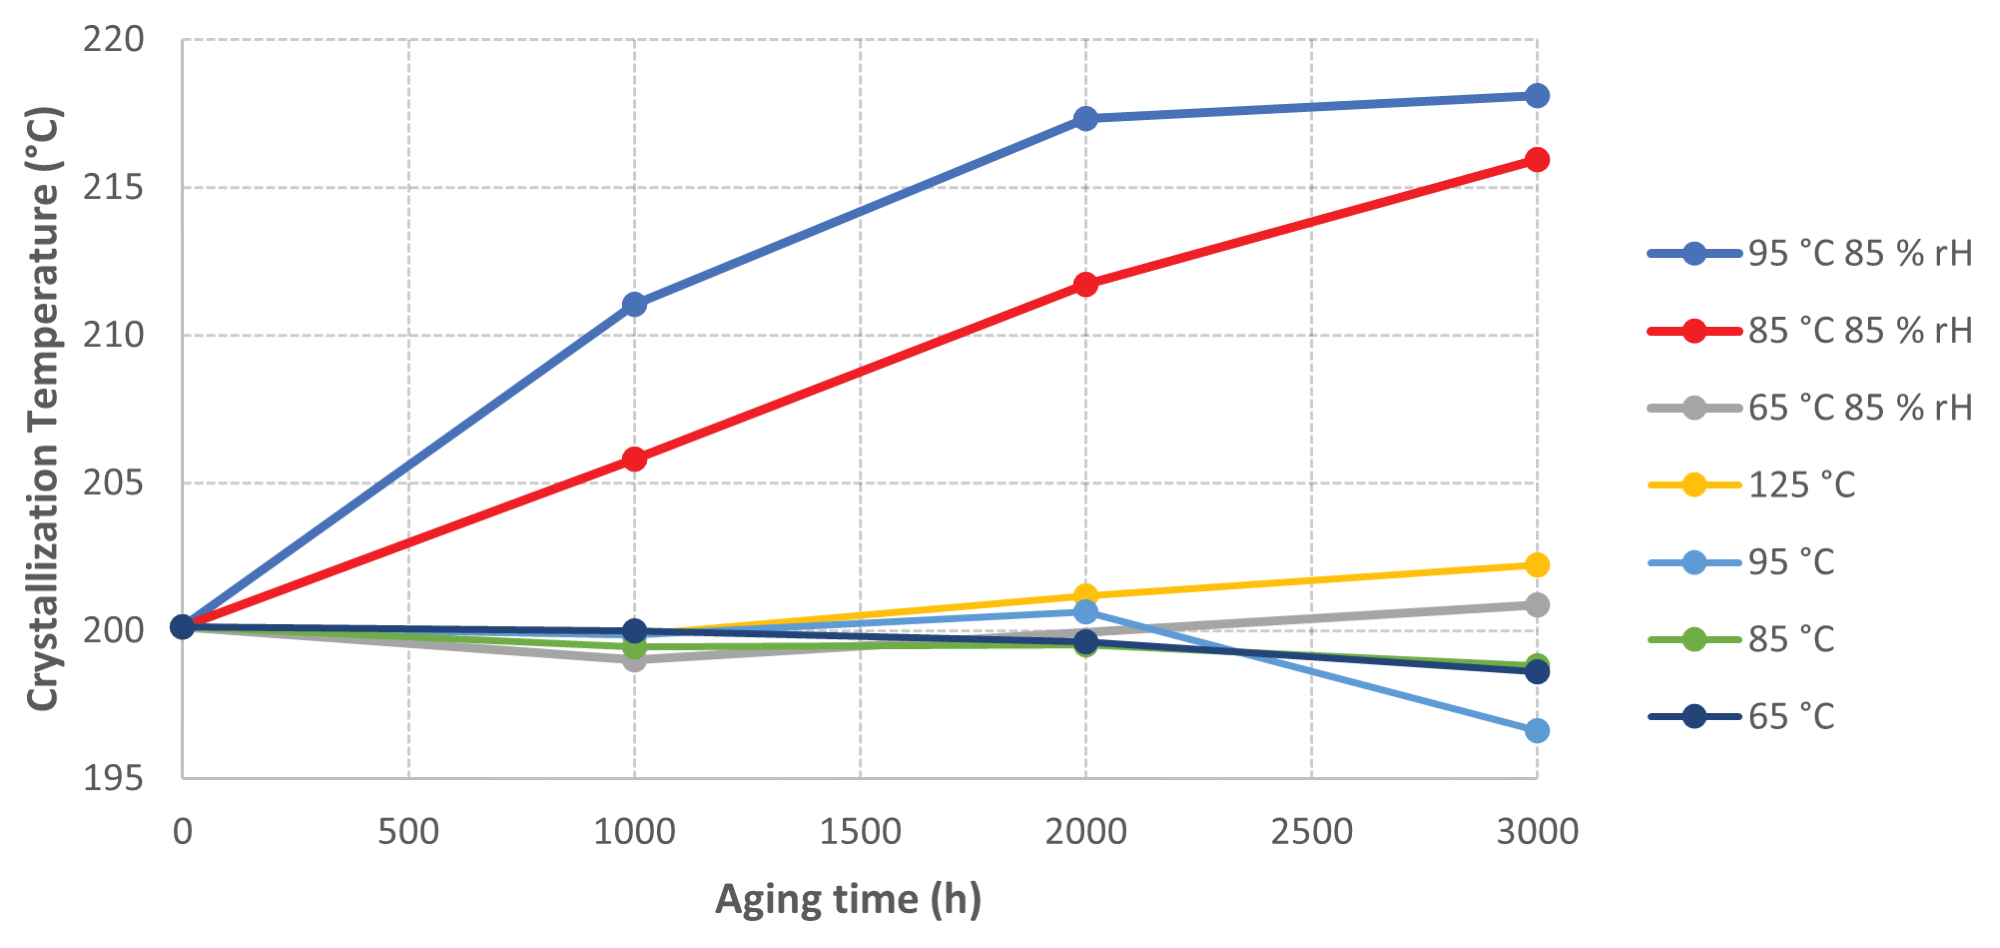
Figure 2. Graph of Crystallization Temperature vs Sample Aging time. Image Credit: PerkinElmer
The crystallization temperature of the PET rises considerably the longer the PET is aged at elevated temperature and humidity. Figures 3 and 4 present an overlay of DSC cooling curves, where the crystallization temperature increases the longer the sample is aged.
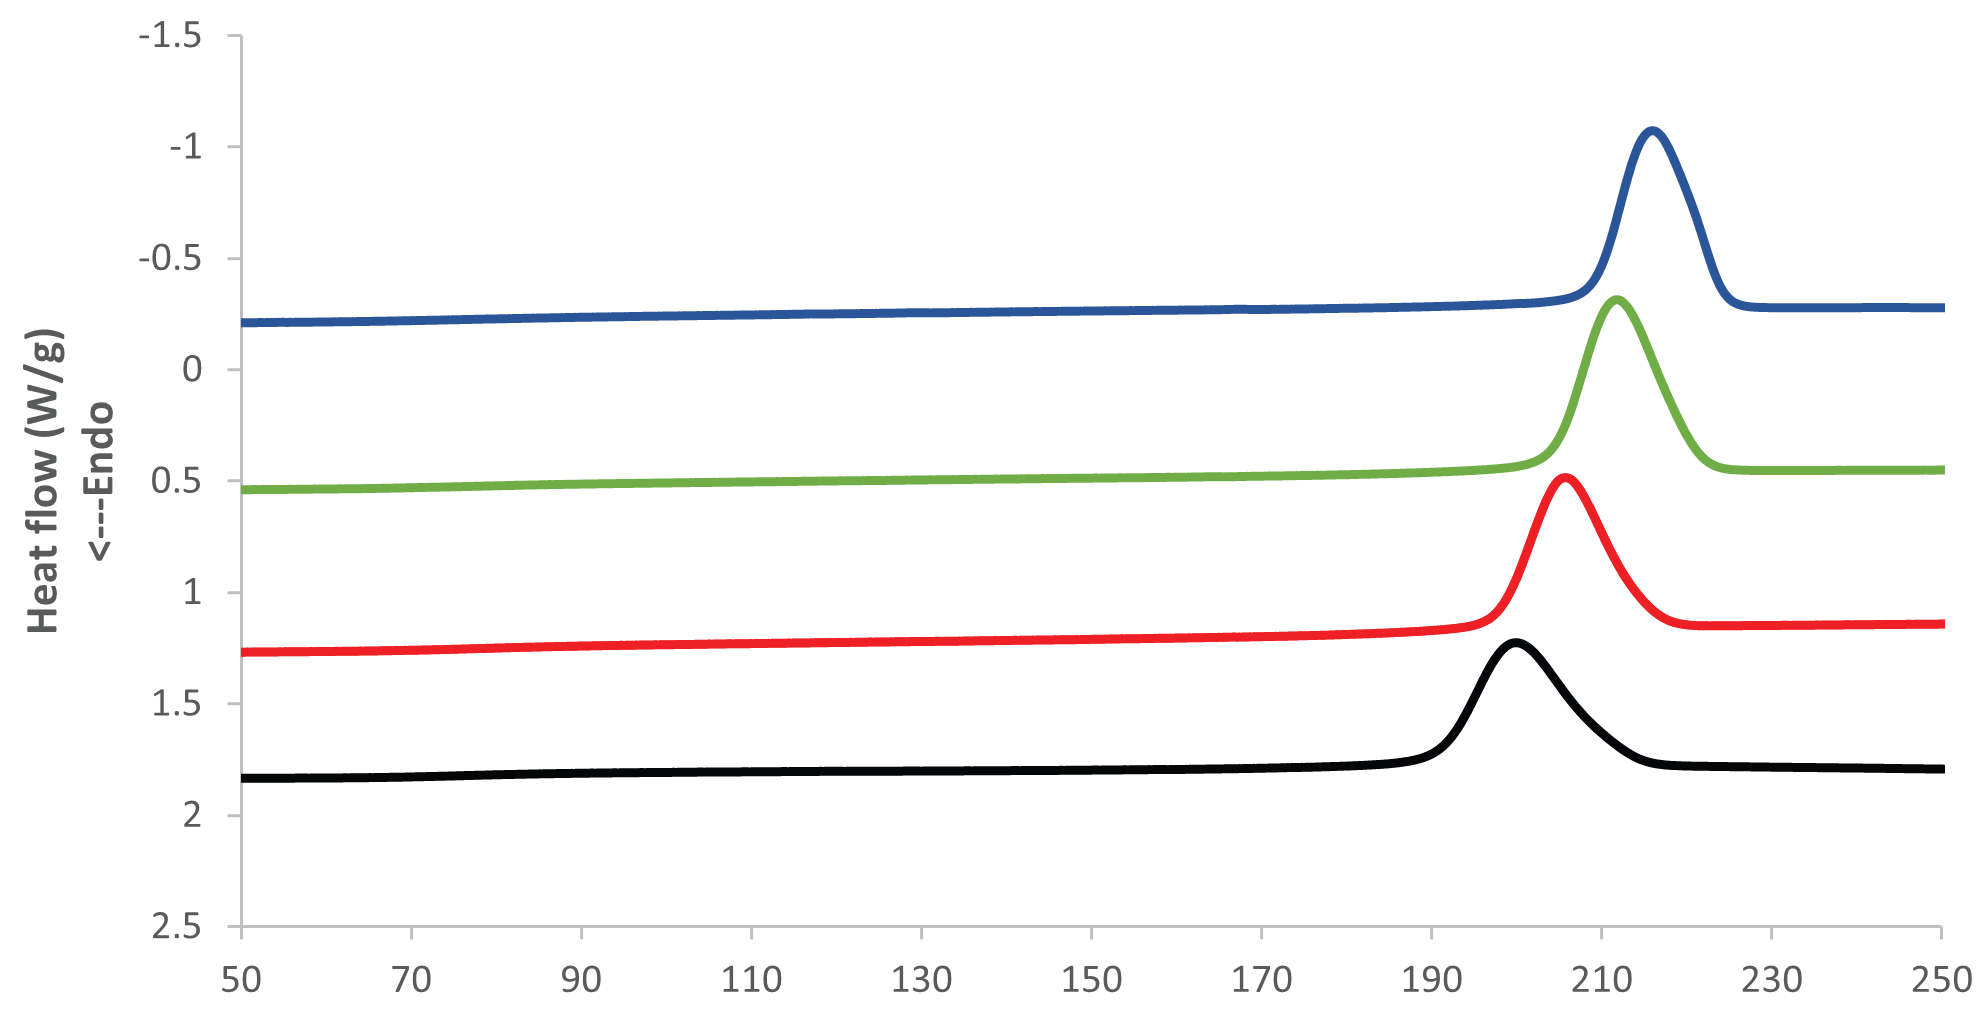
Figure 3. DSC Cooling results at 85 °C and 85 % RH. Image Credit: PerkinElmer
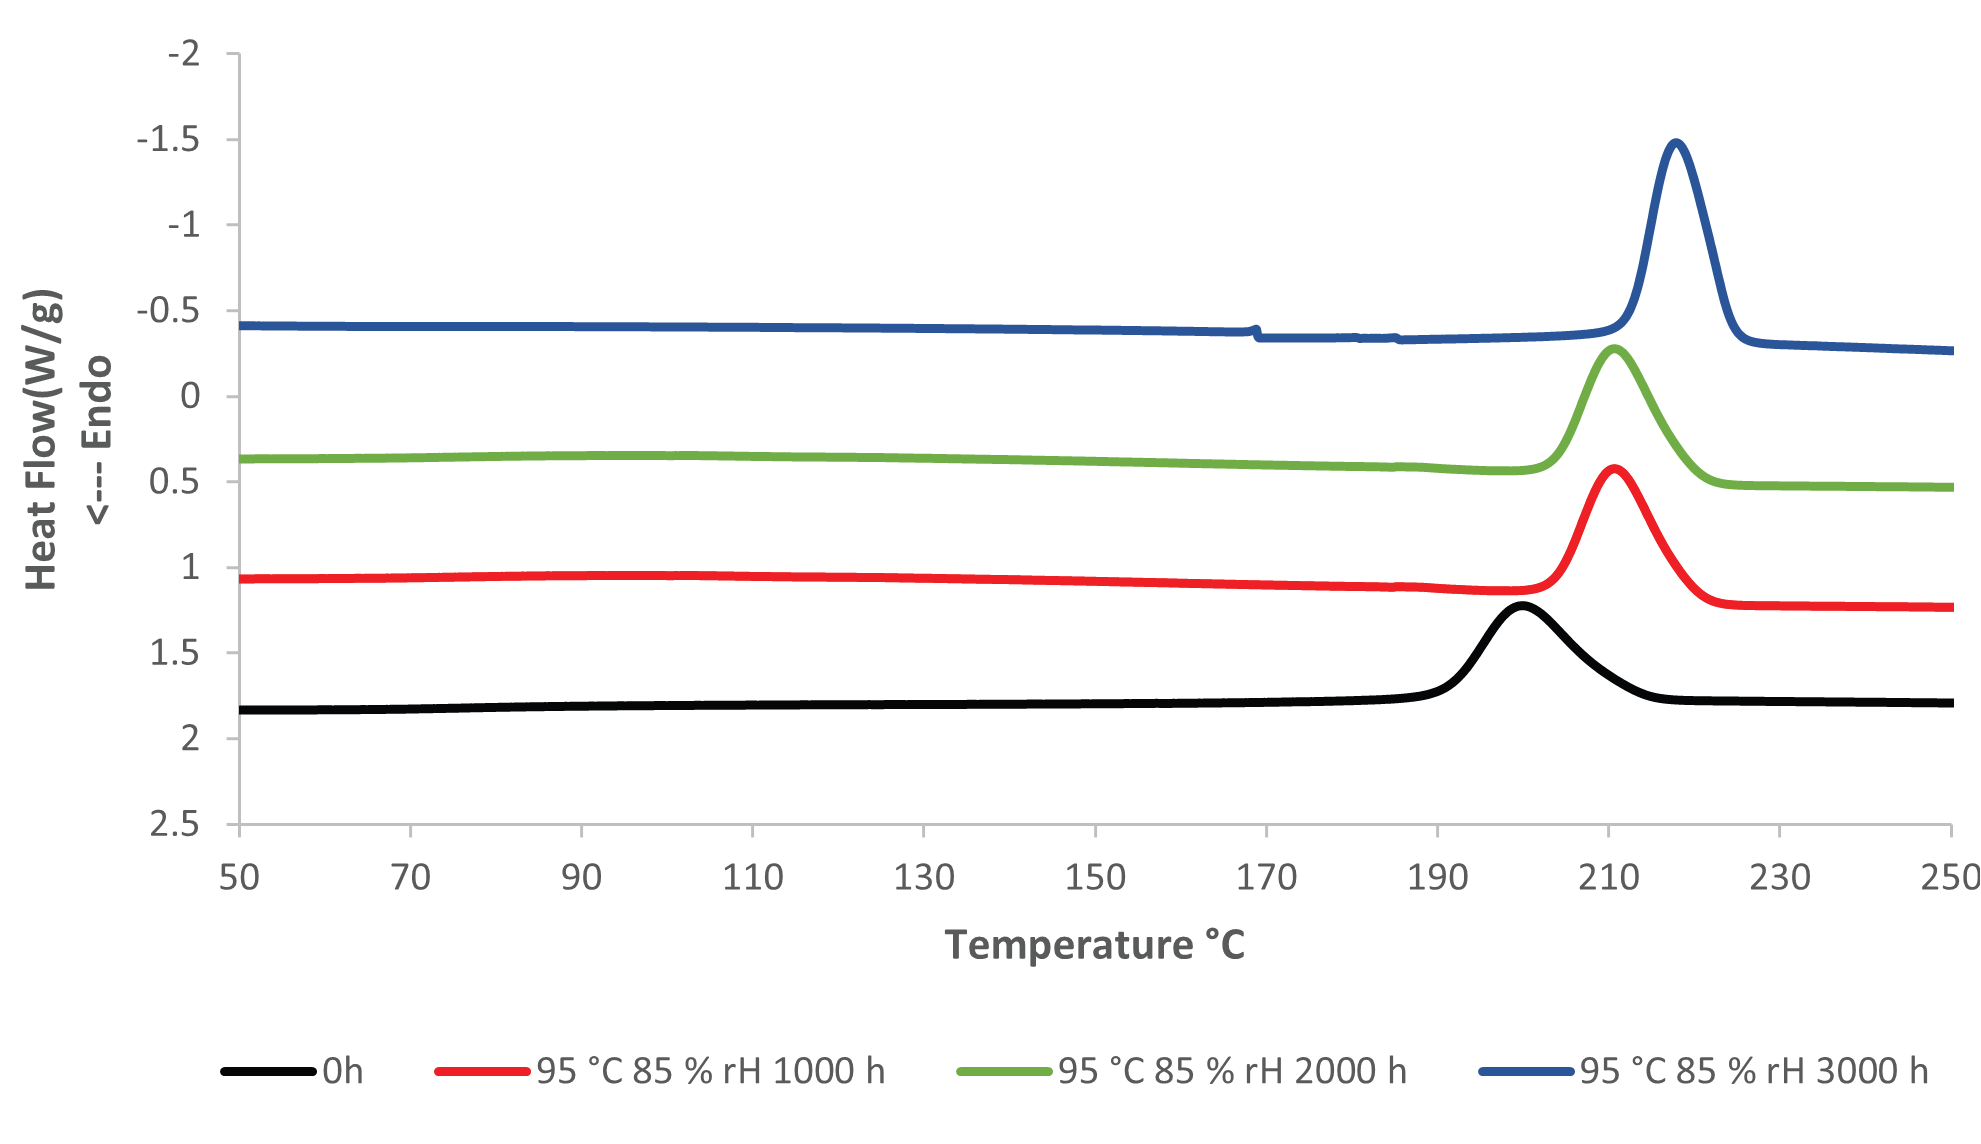
Figure 4. DSC Cooling results, unaged (0h) and aged at 95 °C and 85 % rH. Image Credit: PerkinElmer
A rise in crystallization temperature is caused by a change in the chemical structure of a material (chemical aging), such as a decline in molar mass due to polymer chain scission from hydrolysis.
Shorter polymer chains lead to increased polymer chain ends that may act as nucleating agents for the generation of new crystals with increased crystallization temperatures.2
When evaluating the GPC data for the aged samples, it is clear that there is a decline in molar mass for the aged samples at higher temperatures and humidity. Figure 5 displays a graph of molar mass versus sample aging time.
The samples aged at lower temperatures (65 °C – 95 °C) sustain a reasonably consistent molar mass. The samples aged at 125 °C demonstrate a decrease in molar mass, which could be due to a thermo-oxidation process, given the lack of moisture from ambient humidity for this sample.
The most noticeable results were obtained from the samples aged at elevated temperatures and humidity (85 °C and 95 °C with 85% RH). For both samples, there was a significant loss of molar mass the longer they were aged.
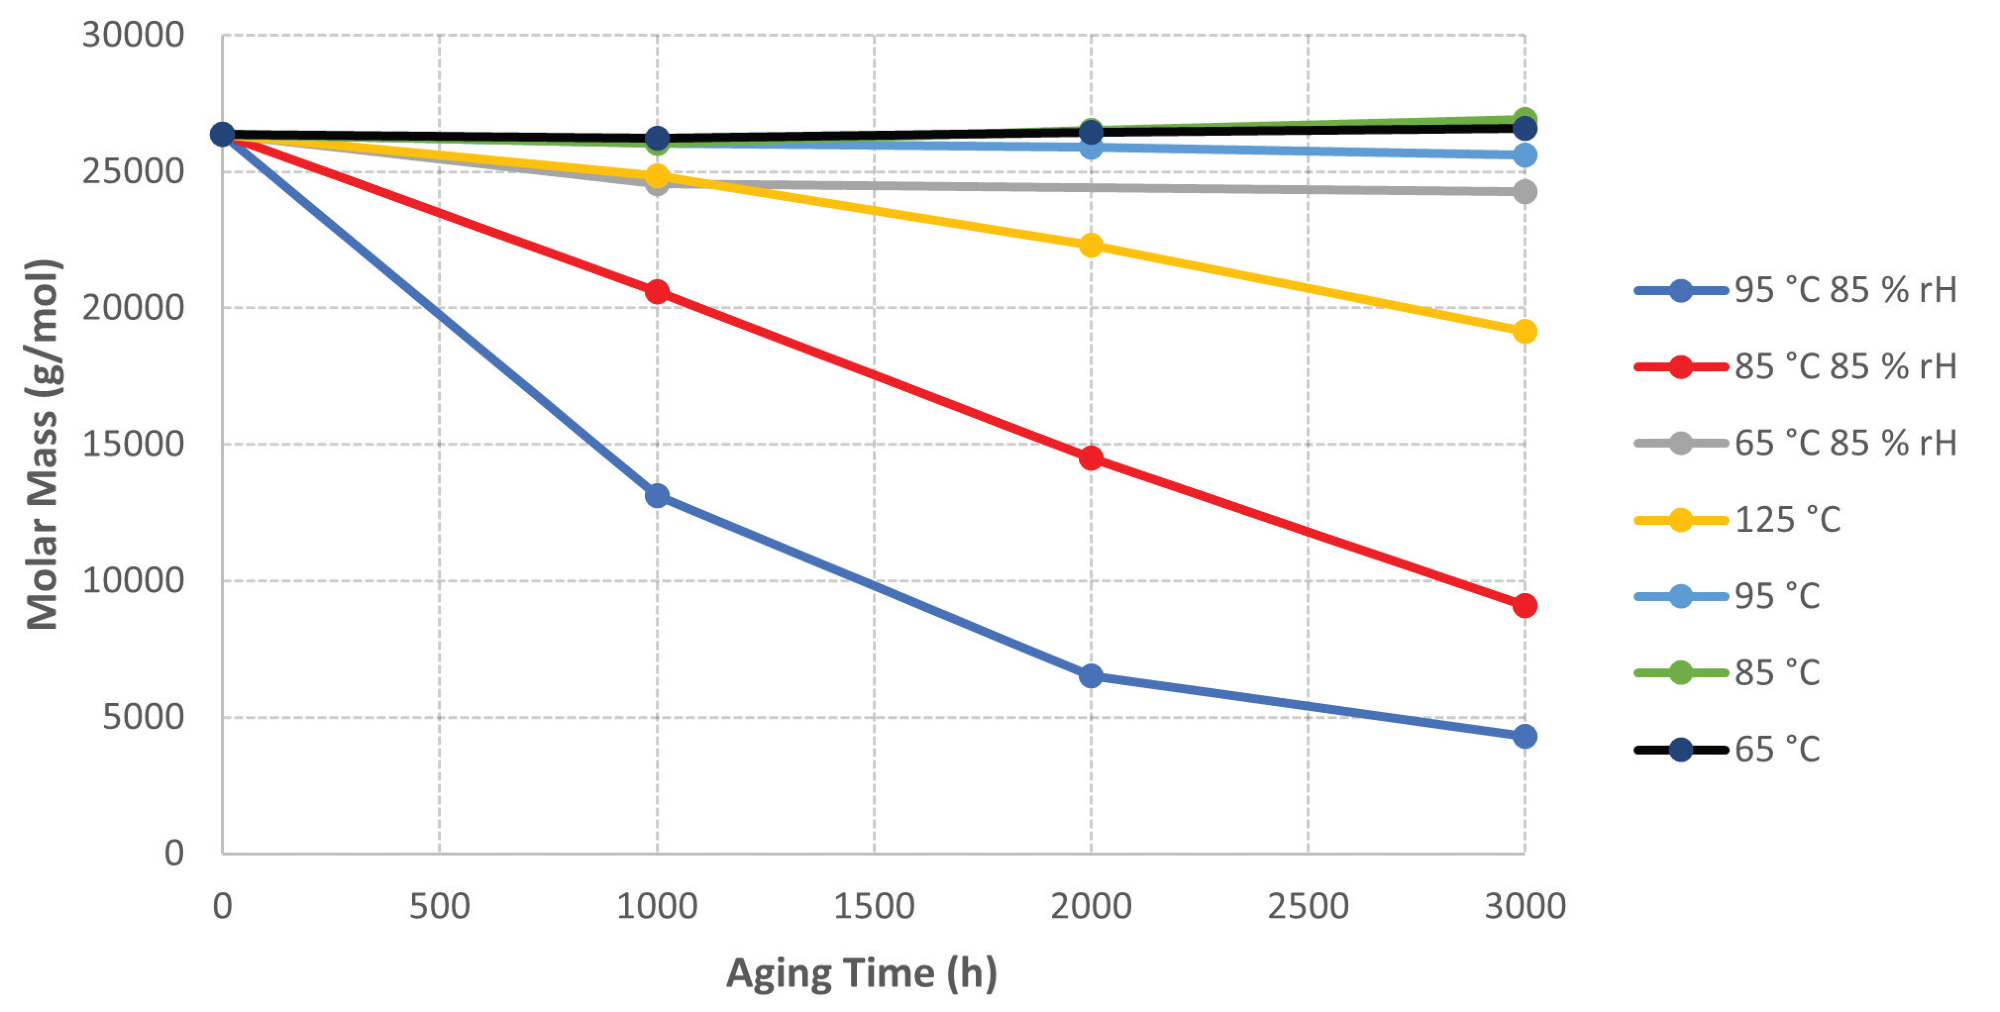
Figure 5. Graph of Molar Mass vs. Sample Aging Time. Image Credit: PerkinElmer
The results display a linear correlation between the crystallization temperature and the GPC data for the samples aged at 85 °C and 95 °C with 85% RH directly. As the crystallization temperature rises, the molar mass decreases for these samples.
Figure 6 displays a plot of the molar mass against the crystallization temperatures for these samples to exhibit the linear relationship between the two parameters with a coefficient of determination (R2) above 0.99 for both samples. This suggests a high level of correlation between the DSC data and GPC data.
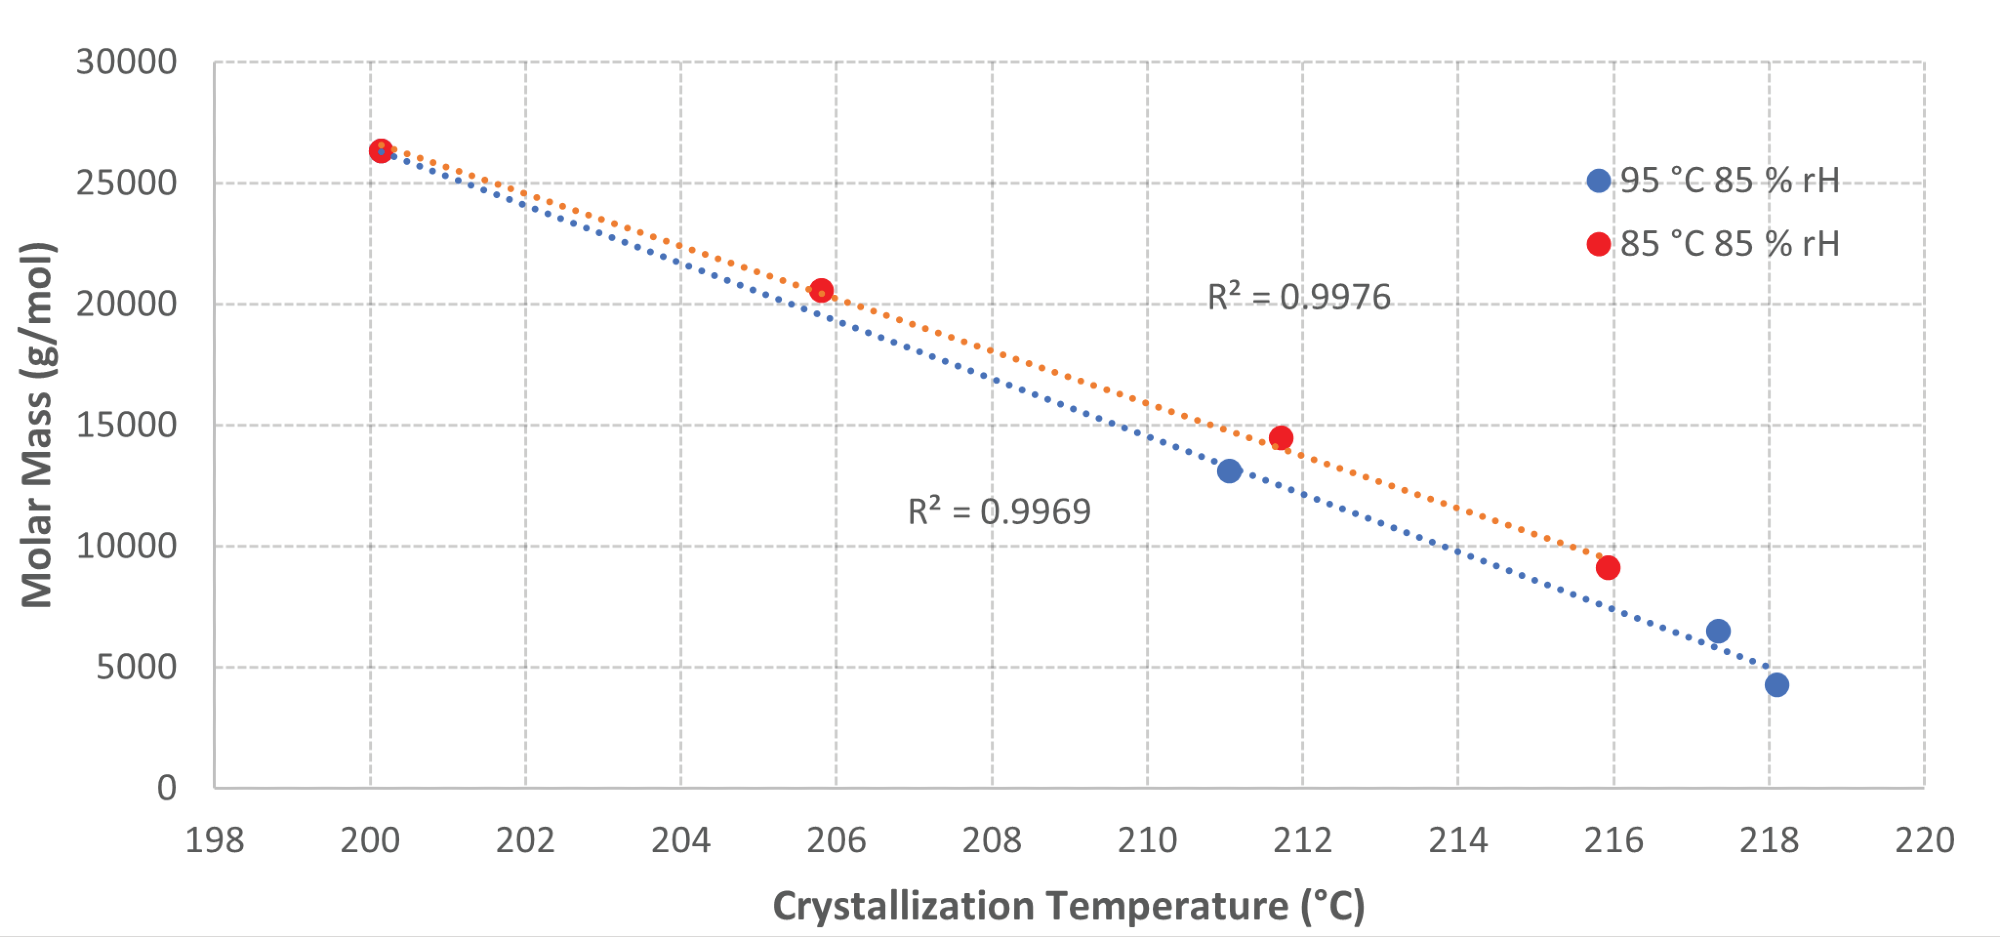
Figure 6. Graph of Molar Mass vs Crystallization Temperature for samples aged at elevated temperatures and humidity. Image Credit: PerkinElmer
Conclusion
There is abundant valuable information to be obtained from the DSC characterization data acquired from aged and unaged PET. When PET is subjected to increased temperature and humidity for prolonged periods, polymer degradation by hydrolysis takes place.
The subsequent chain scission of PET causes a degradation mode that enables ambient water vapor and oxygen to permeate the material more readily. This degradation of PET layers of a PV backsheet leads to module failure and the plastic waste being exposed to the environment.
Comparing the DSC data to GPC data shows that DSC can be utilized to verify PET polymer chain scission faster.
This is an especially valuable parameter to provide insight into the overall stability of the polymer as it ages. The PerkinElmer DSC 4000 is well-suited to these characterization applications of PET films employed in the PV industry.
Acknowledgments
Produced from materials originally authored by Gernot Oreski, at Polymer Competence Center Leoben GmbH, and Nicholas Lancaster and Krystelle Mafina, at PerkinElmer UK.
References and Further Reading
- P. Christöfl et al., “Nanoindentation for fast investigation of PET film degradation” JOM, 2022, 74, pp 2287-2294. DOI: https://doi.org/10.1007/s11837-022-05278-0
- M. Knausz et al., “Degradation of photovoltaic backsheets: Comparison of the aging-induced changes on module and component level.” J.Appl.Pol.Sci. 2015, 132, pp 1 – 8. DOI: https://doi.org/10.1002/app.42093
- G. Oreski. “Degradation of PET – quantitative estimation of changes in molar mass using mechanical and thermal characterization methods.” 1st Central and Eastern European Conference on Physical Chemistry & Materials Science (CEEC-PCMS1). 26th and 30th of July 2022, Split, Croatia.
- K. Weisskopf. “Characterisation of Polyethylene Terephthalate by Gel Permeation Chromatography (GPC).” J.Polym. Sci. 1988, 26, pp 1919 – 1935.
- “Differential Scanning Calorimetry, A Beginners Guide.” PerkinElmer. 2013.

This information has been sourced, reviewed and adapted from materials provided by PerkinElmer.
For more information on this source, please visit PerkinElmer.