With the complexity of biologics manufacturing and the desire for Quality by Design (QbD) processes, the need for timely and information-rich process data is vital for process improvements in economics, safety, and efficiency.
The philosophy of QbD is reliant on effective monitoring and control early in the process, during upstream manufacturing. However, monitoring upstream processes depends on multiple analytical technologies to monitor a few Critical Process Parameters (CPPs).
Only a few techniques monitor the product Critical Quality Attributes (CQAs) directly, with CQAs often indirectly concluded from CPPS monitoring. Mass spectrometry (MS) is a valuable tool that can monitor both key CQAs and CPPs using a single technology.
The information-rich and complete view of the process delivered by MS offers a deeper understanding of how CPPs impact CQAs. This understanding is fundamental for fully implementing Process Analytical Technology (PAT) for monitoring and controlling a process.
The footprint, cost, and complexity of MS equipment have frequently limited the utilization of MS to centralized laboratories, which has impeded MS from being implemented for real-time monitoring of upstream processes at the point of need.
This article presents the development of a miniaturized ESI-MS, the MiD® ProteinlD (see Figure 1), used in combination with Proof-of-Concept (PoC) workflows to provide the monitoring of IgG and metabolites in upstream cell cultures and at the point of need.
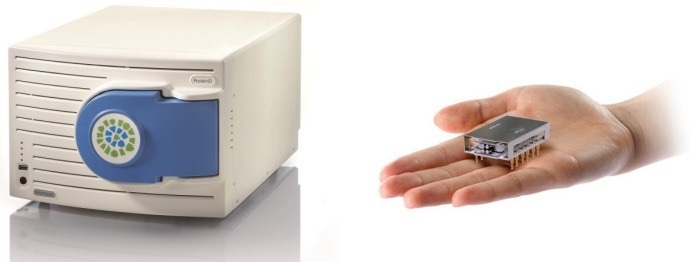
Figure 1. Microsaic MiD® ProteinID mass spectrometer based on miniaturized chip-based technology with an adjustable mass range between 50 and 3200 m/z the monitoring of small molecules in cell culture media and intact IgG is possible with this mass spectrometer. The MS features a miniaturized quadrupole mass filter and microflow electrospray source. The resulting small footprint (55 x 35 25 cm), low maintenance and ease of use allows it to be easily used at-line and at the point-of-need. Image Credit: Microsaic Systems plc
Methodology
The cultivation of four shake flask cultures of anti-Her2 lgG1 expressing CHO cells took place for 14 days at the Centre for Process Innovation (CPI) under favorable and unfavorable conditions in duplicate.
Here, the favorable conditions involved tight glucose limits, whereas the unfavorable conditions involved wider glucose limits and increased feed addition, as presented in Table 1.
At days 0, 3, 5, 7, 9, 11, 13, and 14, samples were harvested from the culture to be analyzed, with the samples undergoing clarification via centrifugation before this.
Table 1. Experimental samples. Source: Microsaic Systems plc
| |
Unfavourable |
Favourable |
| Lower glucose limit (g/L) |
4 |
2 |
| Upper glucose limit (g/L) |
8 |
3 |
| Feed added on alternate days (% volume) |
8 |
4 |
1. lgG Product Analysis
The filtered cell culture samples were injected into a Protein A column without any additional sample preparation. Automated bind and elution from Protein A were performed using volatile buffers to facilitate a direct connection to the MiDTM ProteinlD.
These volatile buffers also facilitated the direct observation of non-binding components and intact lgG during the bind and elution phases. Post-software processing enabled the automation of deconvoluting and extracting intact lgG masses from the mass-to-charge spectra.
2. Cell Media Metabolite Monitoring
Hydrophilic interaction chromatography (HILIC) was employed for monitoring cell media metabolite. This enabled the direct observation of cell media components with little sample preparation. Samples were mixed with buffer and clarified to eliminate precipitates before being injected.
Sample analysis was conducted with a gradient separation, and analytes of interest were monitored via Selected Ion Monitoring (SIM) in negative mode.
A PoC quantitation approach was also evaluated to permit metabolite concentrations to be measured without requiring expensive isotopically labeled standards.
Results
1. lgG Product Analysis
The intact molecular weight of an lgG is a crucial physicochemical CQA and establishing intact mass is part of the ICH 06B guidelines for analyzing biological products.
Utilizing the MiD® ProteinlD with online Protein A separation facilitated the monitoring of these intact lgG masses throughout these cell cultures.
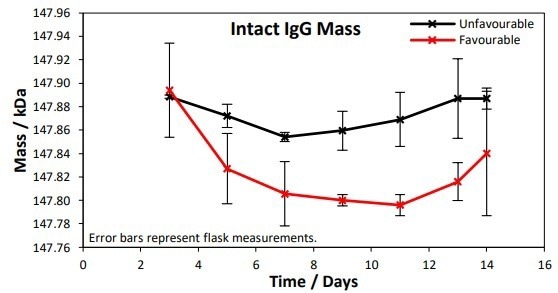
Figure 2. Intact IgG masses were measured at 3, 5, 7, 9, 11, 13 and 14 days. A 50 Da difference in IgG mass between the favorable and unfavorable conditions was observed at the 1% significance level. Image Credit: Microsaic Systems plc
The monitoring of the lgG masses over the 14-day culture for favorable and unfavorable conditions is displayed in Figure 2. Across the time points, a mean difference of 50 Da was observed between the unfavorable and favorable conditions, at the 1% significance level.
Further species could also be seen in the mass spectra from additional peaks in the mass-to-charge spectra, as presented in Figure 3. These peaks are caused by lgG fragments, particularly the HHL fragment at a mass of ~122 kDa.
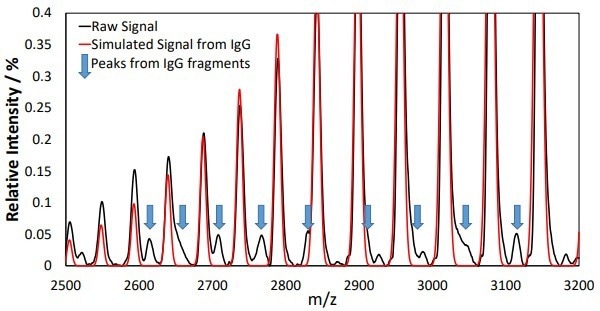
Figure 3. Additional peaks in the mass-to-charge spectra could be observed following elution from the Protein A column. Peaks from the IgG product at different charge states dominate the spectra and their positions can be seen from the simulated IgG spectrum overlaid in red. Additional peaks that do not match with the red spectrum can be observed and are highlighted with blue arrows. These peaks can be assigned to masses indicative of IgG fragments. Image Credit: Microsaic Systems plc
Monitoring these further peaks in the mass-to-charge spectra aided this fragment in being tracked relative to the main lgG product during the culture, as shown in Figure 4.
Across the conditions, similar kinetics were seen for the lgG and 122 kDa fragments and the relative proportions of these species seem equivalent under both favorable and unfavorable conditions.
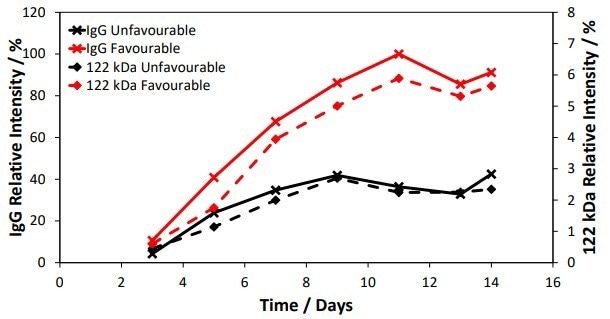
Figure 4. Tracking of the 122 kDa species (HHL fragment) relative to IgG with time. Image Credit: Microsaic Systems plc
2. Cell Media Metabolite Monitoring
Monitoring metabolites within a cell culture is crucial for optimizing the cells’ health and boosting titer and product quality. Regular monitoring of glutamine, lactate, glucose, and glutamate is performed.
The measurements for these four metabolites utilizing the PoC HILIC-MS methodology are presented in Figure 5. Measurements acquired with a photometric analyzer were also carried out and are included in Figure 5 for comparison.
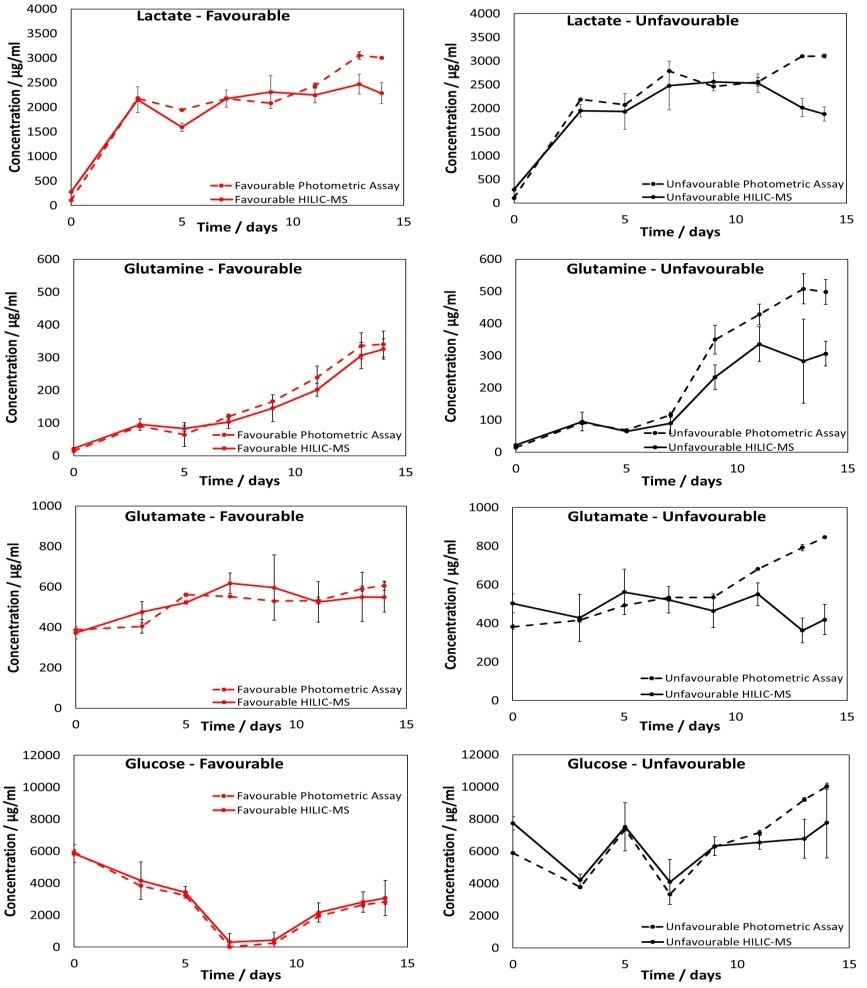
Figure 5. Results from the PoC HILIC-MS methodology quantifying lactact, glucose, glutamin, and glutamate in the favorable and unfavorable samples. Measurements from the photometric analyzer are also shown. Error bars represent the 95% CL across flask measurements. Image Credit: Microsaic Systems plc
A good correlation was seen between the MS and photometric analyzer measurements. However, deviation occurs between the MS and photometric analyzer measurements for the unfavorable samples after approximately 11 days.
This disagreement in behavior between the favorable and unfavorable conditions is presented in a heat map of z-scores (see Figure 6) to represent the difference between the photometric analyzer and HILIC-MS measurements across conditions.
The cause of this is not currently known and demands further research. However, it is hypothesized that more by-products are likely to arise from cell death in the unfavorable samples relative to the favorable samples, especially near the end of the cell culture.
This growth in by-products could interfere with the photometric assays.
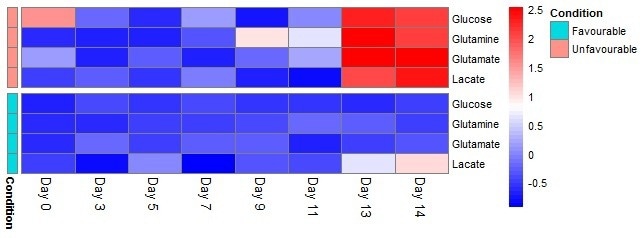
Figure 6. Heat map of z-scores for the difference between photometric analyzer and HILIC-MS measurements across time-points and conditions. Large deviations between measurements are observed after ∼11 days for the unfavorable samples. This is represented as the red area in the top right of the heat map. Image Credit: Microsaic Systems plc
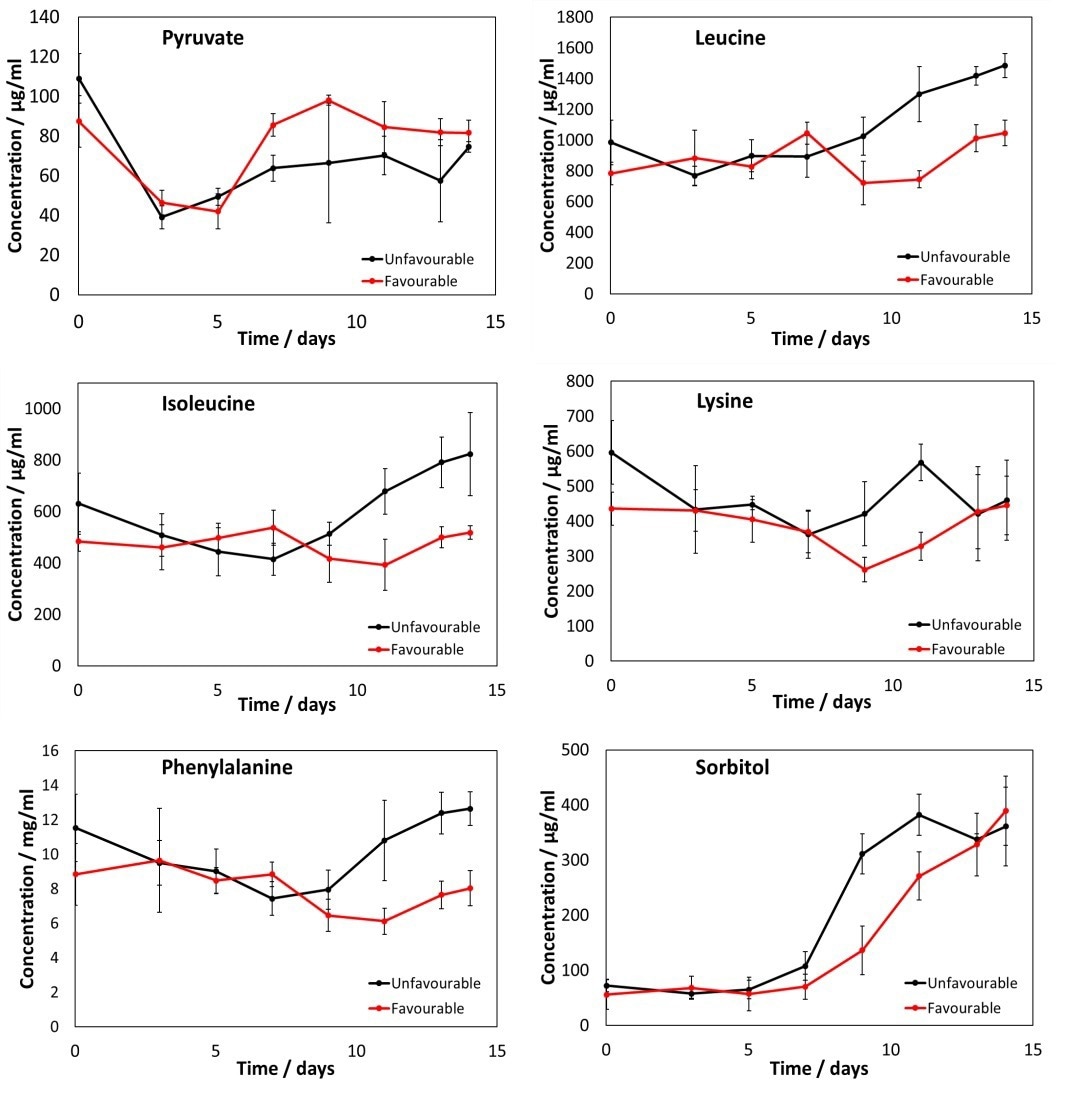
Figure 7. Metabolite profiles for pyruvate, leucine, isoleucine, lysine, phenylalanine and sorbitol for both favourable and unfavourable conditions. Clear differences between the unfavourable and favourable conditions can be seen. Error bars represent 95% CL across flask measurements. Image Credit: Microsaic Systems plc
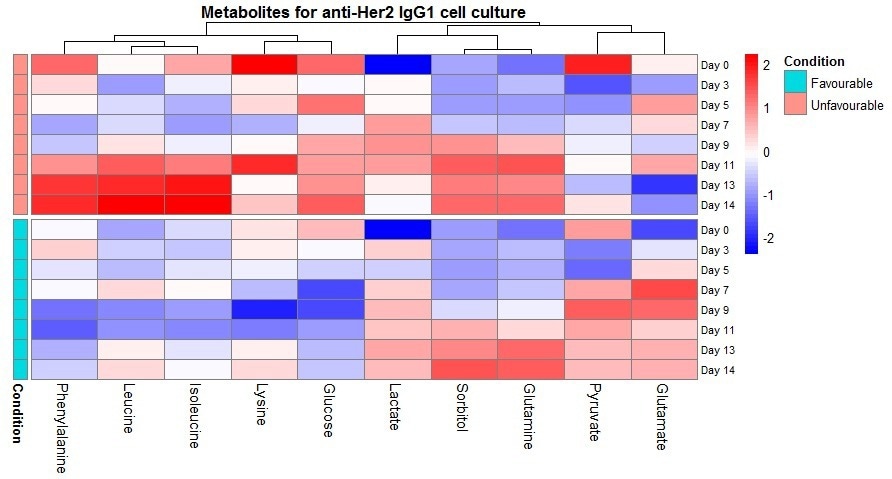
Figure 8. Heatmap of metabolite z-scores across timepoints and conditions. Clustering is from Euclidean distance. Image Credit: Microsaic Systems plc
MS is capable of monitoring other metabolites, which provides a highly detailed picture of cell culture health. Here, six other metabolites were also monitored in parallel with the PoC HILIC methodology, as shown in Figure 7.
The resultant metabolite profiles display clear distinctions between the cultures grown in favorable and unfavorable conditions. The utilization of MS facilitates the monitoring of a significant number of analytes, paired with the collection of a vast amount of data to deliver a more comprehensive picture of cell culture health.
The collection of more data frequently leads to the end user being burdened with more complex data interpretation, particularly when MS is being used at the point of need by non-MS specialists. As a result, the simplification of this data interpretation is imperative for using MS at the point of need.
To simplify the data collected in these tests, a metabolite heatmap (as presented in Figure 8) was generated to enable the extraction of information from the large data set to be rapid and straightforward. The heatmap exhibits clear distinctions in temporal profiles between the conditions.
The different behavior for phenylalanine, isoleucine and leucine throughout the culture caused these species to be clustered. The clustering behavior also implies that the behavior of glutamate and pyruvate opposes that of phenylalanine, isoleucine, and leucine.
Conclusion
Using the Microsaic MiDTM ProteinlD in conjunction with an automated protein A workflow allowed simplified measurements as well as the monitoring of intact lgG from the cell culture directly.
The additional use of a PoC HILIC-MS assay enabled the measurements of metabolites in cell media to be obtained with little sample preparation. There was a good correlation between the metabolite measurements and the photometric assay measurements obtained in parallel.
However, further research is needed concerning the deviations from the photometric assays approaching the end of the cell culture under unfavorable conditions.
Further automation of sample preparation is expected to enhance measurement speed, accuracy, and precision. Utilizing bespoke configurations of protein A and HILIC would also enable the use of smaller sample volumes and lower flow rates.
Acknowledgments
Produced from materials originally authored by Microsaic Systems Plc. The original authors wish to thank the Centre for Process Innovation (Darlington, UK) for undertaking shake flask cultures, providing photometric assay data, and assisting in data interpretation.

This information has been sourced, reviewed and adapted from materials provided by Microsaic Systems plc.
For more information on this source, please visit Microsaic Systems plc.