Perfluorinated alkyl substances (PFAS) are man-made chemicals widely used in various applications, such as waterproof coatings and non-stick cookware. Due to their high resistance to degradation in the environment, PFAS may be referred to as “forever chemicals”.1
This high resistance to degradation has resulted in the accumulation of PFAS in various areas, such as water systems, soils, plants, animals, and humans.2
Growing evidence shows that exposure to PFAS can cause many adverse health effects, including cancer, effects on the immune system, hormone disruption, and low birth weights in infants.1
As a result, there is increasing interest in measuring the levels of PFAS in environmental samples, but current instrumentation and methods are lacking.
To overcome this, Microsaic Systems has developed a portable online solid phase extraction—liquid chromatography coupled with mass spectrometry (SPE-LC-MS) based method that brings the laboratory to the sample.
An automated online SPE and LC Pump System was employed to load and separate the PFAS samples and Microsaic’s 4500 MiD® compact Mass Spectrometer (MS) to detect PFAS.
The SPE-LC-MS system was set up in two distinct formats: an in-laboratory setup in an air-conditioned laboratory using mains power and a remote in-field setup outside using a generator with a maximum power output of 1.0 kW and an N2 bottle.
Table 1. SPE and LC conditions. Source: Microsaic Systems plc
| |
|
| SPE Cartridge |
Strata-X-AW 33 µm polymeric weak anion exchange 20 x 2.0 mm |
| LC Column |
Phenomonex Gemini 3 mm C18 110 Å 50 x 2 mm |
| LC Flow Rate |
0.3 ml/min |
| Column Temp. |
25 °C |
| Sample Volume |
50 ml |
| Mobile Phase A |
H2O + 0.4 % ammonium hydroxide |
| Mobile Phase B |
MeOH + 0.4 % ammonium hydroxide |
| Analysis Time |
38 min |
The LC gradient runs in parallel with the SPE, and the sample is not eluted from the SPE until 22.15 minutes. The gradient is held at 90% B for the first 10 minutes to avoid the accumulation of contaminant PFAS from the system, and the gradient is brought to starting conditions before elution to guarantee equilibration of the column.
The water samples were collected in 250 ml polypropylene bottles, spiked with 200 ppt of PFAS standards and stable isotope-labeled internal standards.
The samples were then filtered through a 0.5 mm glass fiber filter with polypropylene syringes and subsequently filtered through a 0.20 mm cellulose membrane filter.
After the samples are loaded onto the SPE cartridge, an automated wash step occurs, followed by a second wash step with the LC flow. This takes place before the elution of the PFAS by increasing the amount of organic mobile phase.

Figure 1. Full system shown for the work presented. Left: Automated online SPE-LC pump system, Centre: Column thermostat, Right: Microsaic 4500 MiD® mass spectrometer. The resulting small footprint allows for it to be fully deployable and at the point-of-need. Image Credit: Microsaic Systems plc
Table 2. MS settings. Source: Microsaic Systems plc
| Scan mode |
SIM (Single Ion Monitoring) |
| Scan rate |
1 Hz |
| Step |
0.2 |
| SIM |
PFOA m/z 412.8,
M2PFOA (IS) m/z 414.8,
PFOS m/z 498.8,
MPFOS (IS) m/z 502.8 |
| Ion mode |
Negative |
| Gas flow |
1.5 l/min |
Results
The chromatographic separation between PFOS and PFOA was unchanged between spiked canal water and HPLC water, as displayed in Figure 2 and Figure 3.
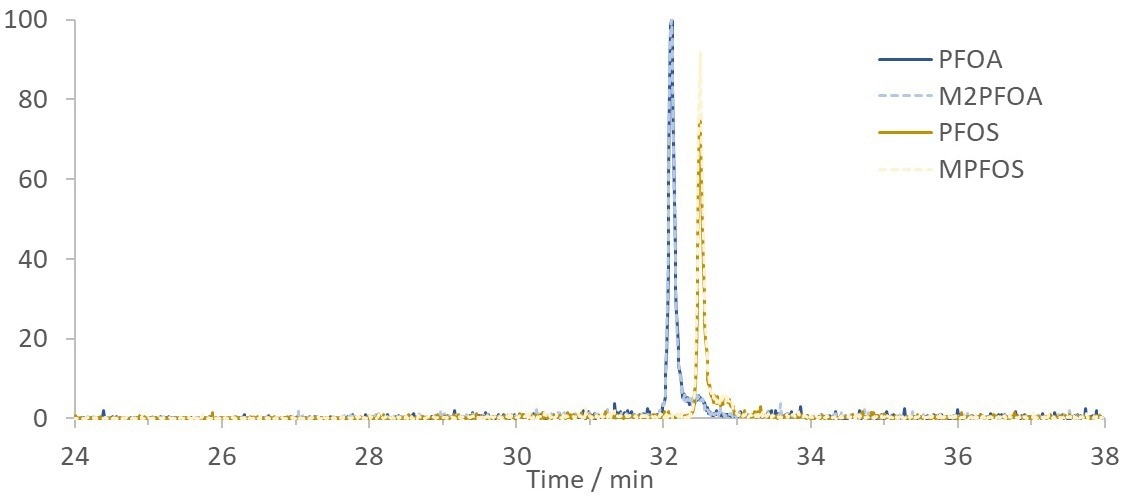
Figure 2. Chromatogram showing SIM traces of 200 ppt PFOA and PFOS standards in HPLC grade water with internal standards, M2PFOA and MPFOS, analyzed using the in-field setup. Image Credit: Microsaic Systems plc
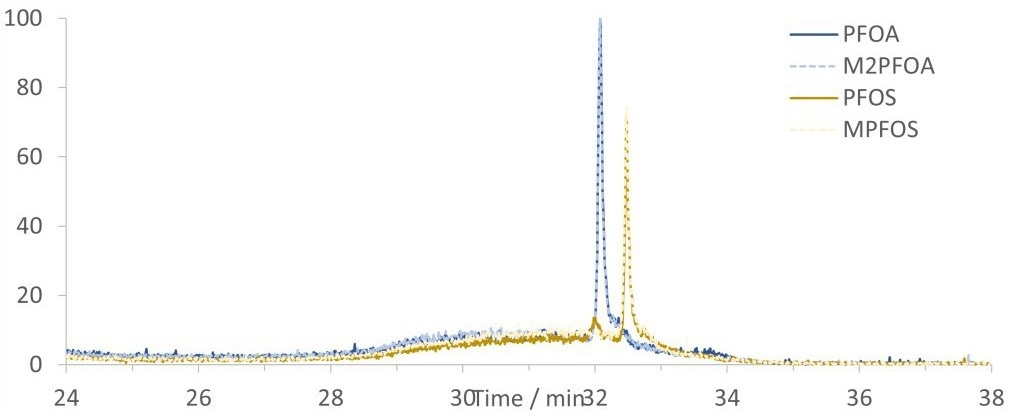
Figure 3. Chromatogram showing SIM traces of 200 ppt PFOA and PFOS spiked canal water with internal standards, M2PFOA and MPFOS, analyzed using the in-field setup. Image Credit: Microsaic Systems plc
However, there was significant background noise in the canal water samples caused by matrix components (as shown in Figure 3). This required a wash step before elution from the SPE to shift the matrix components away from the PFAS peaks.
The chromatography was consistent between the samples analyzed in-field and in-laboratory, and no system contamination peaks were observed, as shown in Figure 5.
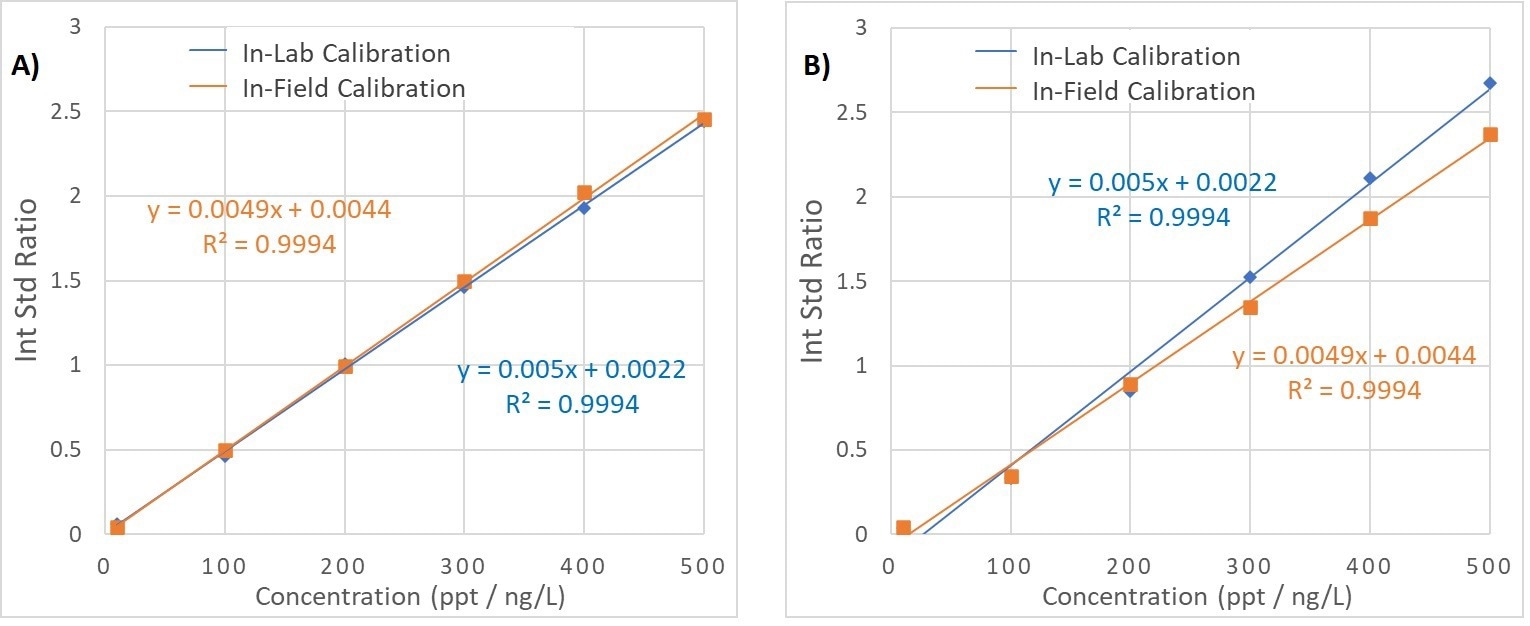
Figure 4. Calibration curves for PFOA vs. M2PFOA (A) and PFOS vs. MPFOS (B). Each graph shows data for the calibration curve created in-lab (shown in blue) and using the in-field set-up (shown in orange.). Image Credit: Microsaic Systems plc
Calibration curves were generated in the range of 10—500 ppt with minimal deviation in the regression values and high recoveries for each in the spiked samples, as shown in Figure 4.
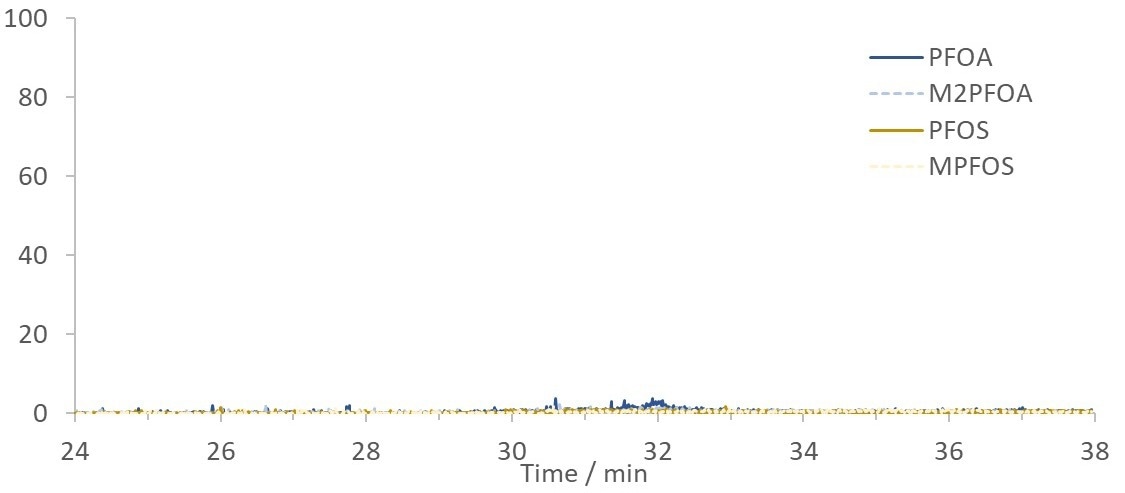
Figure 5. Blank chromatogram of HPLC grade water showing the lack of PFAS peaks from potential system contamination. Image Credit: Microsaic Systems plc
The calibration curves for PFOS and PFOA were consistent between the in-field and in-laboratory analysis (as seen in Figure 4), which enables a calibration curve generated in-laboratory conditions to be applied to samples that were analyzed in-field.
This minimized the number of samples that require analysis while working remotely.
For the spiked canal water samples, standard recovery was between 94% and 106%. The determined concentrations and standard recoveries were consistent between the same samples analyzed in the in-field and in-laboratory setups.
The utilization of online SPE-LC-MS for PFAS analysis in water samples reduces the amount of required sample preparation.
The system does not consume much power, which allows the whole set-up to be run using a small generator, while the compact size of the 4500 MiD® means the system is highly portable and capable of fitting in the back of a car or van.
There is no significant difference in results between the samples that were analyzed using a traditional laboratory-based set-up and the remote in-field set-up.
Conclusion
The utilization of the Microsaic 4500 MiD® together with an automated online SPE-LC facilitates the first completely remote and fully automated on-site study of PFAS in water, with results comparable to laboratory-based setups.
Moving these detection tools to the point of need for the analysis of PFAS in water enables the monitoring of whole ecosystems and the mapping of these issues by geography and time.
References and Further Reading
- Sunderland, Elsie M., et al. "A review of the pathways of human exposure to poly-and perfluoroalkyl substances (PFASs) and present understanding of health effects." Journal of exposure science & environmental epidemiology 29.2 (2019): 131-147.
- Beans, Carolyn. "News Feature: How “forever chemicals” might impair the immune system." Proceedings of the National Academy of Sciences 118.15 (2021).

This information has been sourced, reviewed and adapted from materials provided by Microsaic Systems plc.
For more information on this source, please visit Microsaic Systems plc.