Several factors influence the lower limit of effective particle size detection using the dynamic light scattering (DLS) method. These factors include the optical path design, detector type, laser power of the instrument, and the correlator's computational ability. This limit is a concern for users.
Previous studies have used small molecule samples to verify the lower detection limit of DLS, including vitamin B1 (with a molecular weight of 337.29 Da) and sucrose (with a molecular weight of 342.3 Da).
These small molecules, with molecular weights of 300-400 Da, present considerable challenges for DLS equipment because of their extremely low molecular weights, rapid decay of correlation functions, and weak scattering signals.
This article presents a study considering how the BeNano nanoparticle size analyzer from Bettersize can be employed to measure glucose.
With a molecular weight of just 180.16 Da, glucose has a smaller molecular size than both vitamin B1 and sucrose. The scattering ability of glucose is also lower than sucrose samples, making the measurement more challenging.
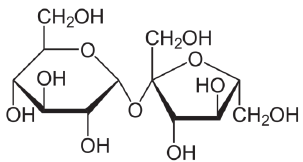
Structural formula of sucrose (molecular weight 342.3 Da). Image Credit: Bettersize Instruments
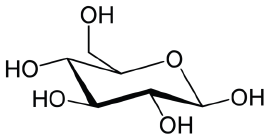
Structural formula of glucose (molecular weight 180.16 Da). Image Credit: Bettersize Instruments
Instrumentation
Bettersize Instruments’ BeNano 180 nanoparticle size analyzer was employed for this study. The instrument has a laser source with a wavelength of 671 nm and a power of 50 mW. An APD detector placed at an angle of 173 degrees was employed to detect scattered light signals.
The signal-to-noise ratio was optimized using single-mode optical fibers for signal transmission. The BeNano analyzer was equipped with a high-speed correlator that operates at the nanosecond level, allowing quick correlation calculations for the rapid decay of correlation functions that comes with small particles.
Viscosity Correction
The viscosity information was corrected before any measurements were taken due to the viscosity of aqueous solutions of glucose and sucrose varying with concentration. This correction involved the addition of polystyrene spheres with a nominal diameter of 100 nm to the solutions.
Through measuring the polystyrene spheres’ diffusion coefficient (D), viscosity information was acquired by utilizing the Stokes-Einstein equation, which links viscosity (η) to diffusion coefficient (D) and particle diameter (dH).
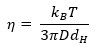
This technique is widely utilized in DLS to determine the viscosity of unknown solutions, particularly in cases with a limited sample volume and the inability to fulfill the requirements of viscometers or rheometers.
Since glucose and sucrose molecules are small with extremely weak scattering, their contribution to the signal is negligible relative to the 100 nm polystyrene spheres. Table 1 and Table 2 detail the measured viscosities.
Table 1. Glucose samples. Source: Bettersize Instruments
| No. |
Solution concentration |
Solution viscosity |
| 1 |
20% |
1.53 mPa.s/cp |
| 2 |
10% |
1.15 mPa.s/cp |
Table 2. Sucrose samples. Source: Bettersize Instruments
| No. |
Solution concentration |
Solution viscosity |
| 1 |
20% |
1.77 mPa.s/cp |
| 2 |
10% |
1.25 mPa.s/cp |
Experimental
Solutions of sucrose and glucose at concentrations of 10% and 20% were prepared. A test temperature of 25 °C ± 0.1 °C was preserved using the built-in temperature control system of the BeNano system.
Since the sample particles are extremely small and display weak scattering, the presence of impurities, such as dust, can affect the detection process considerably. To overcome this issue, a 220 nm PTFE filter was employed to filter the sample during the experiment.
Subsequently, the filtered sample was directly injected into the cuvette. Each sample was measured a minimum of three times to evaluate the reproducibility of the results and to acquire the standard deviation of the results.
Results
The results of the correlation functions and size distribution are obtained using the raw scattered light signals.
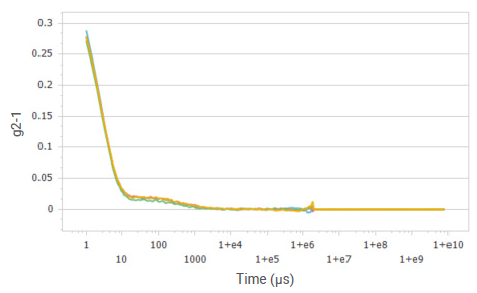
Figure 1. Correlation functions of glucose solution at a concentration of 20%. Image Credit: Bettersize Instruments
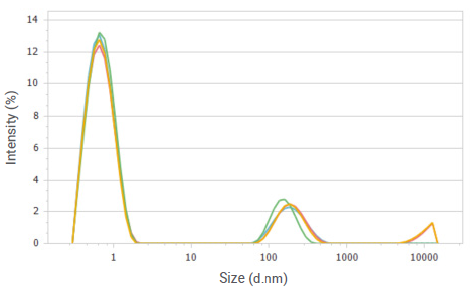
Figure 2. Intensity distributions of glucose solution at a concentration of 20%. Image Credit: Bettersize Instruments
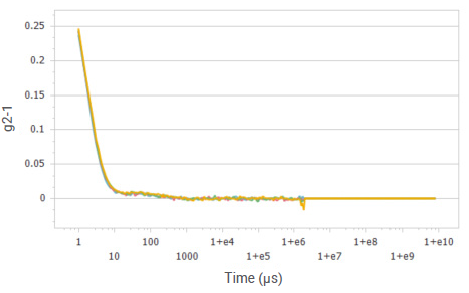
Figure 3. Correlation functions of glucose solution at a concentration of 10%. Image Credit: Bettersize Instruments
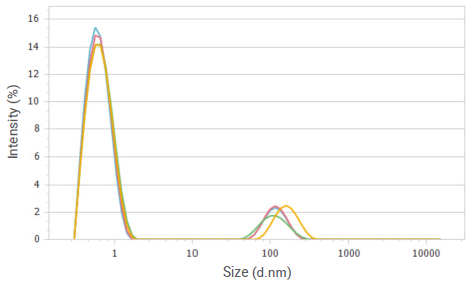
Figure 4. Intensity distributions of glucose solution at a concentration of 10%. Image Credit: Bettersize Instruments
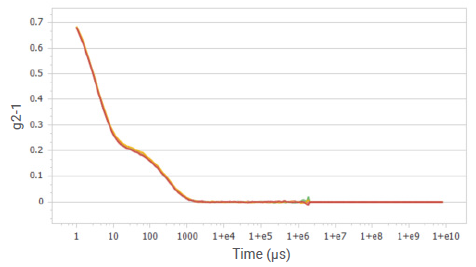
Figure 5. Correlation functions of sucrose solution at a concentration of 20%. Image Credit: Bettersize Instruments
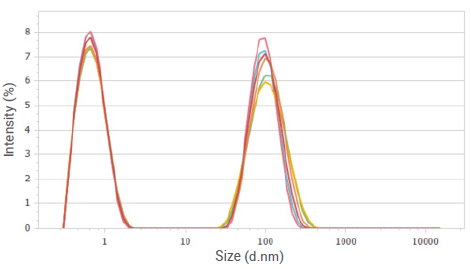
Figure 6. Intensity distributions of sucrose solution at a concentration of 20%. Image Credit: Bettersize Instruments
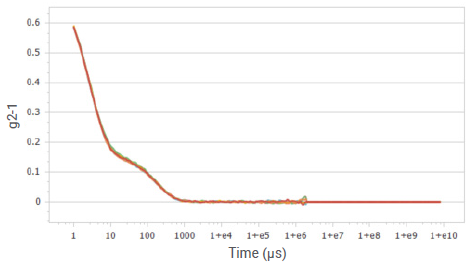
Figure 7. Correlation functions of sucrose solution at a concentration of 10%. Image Credit: Bettersize Instruments
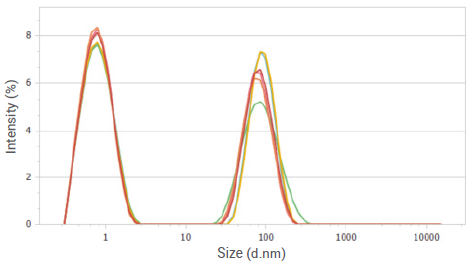
Figure 8. Intensity distributions of sucrose solution at a concentration of 10%. Image Credit: Bettersize Instruments
The correlation functions exhibit a rapid decay for small particles, displaying their increased Brownian motion relative to larger particles. These correlation functions show a favorable signal-to-noise ratio and high repeatability.
The correlator's capacity to conduct extremely short-time correlation calculations guarantees an adequate number of signal points on the correlation function, facilitating the accurate determination of small particles.
Table 3. Particle size results for sucrose and glucose. Source: Bettersize Instruments
| Sample Name |
Average hydrodynamic size (d.nm) |
| 20% sucrose |
27.29±1.01 |
| 10% sucrose |
11.86±0.93 |
| 20% glucose |
0.98±0.01 |
| 10% glucose |
0.81±0.06 |
Figures 1, 3, 5, and 7 present the correlation functions for multiple tests performed at the different concentrations. The results exhibit excellent reproducibility of correlation functions for glucose and sucrose solutions, displaying two distinct decays.
This indicates the presence of at least two fractions with significantly distinct particle sizes in these solutions. Previous studies show the existence of large molecular aggregates in sucrose solutions, which aligns with the particle size distribution curves shown in Figure 6 and Figure 8.
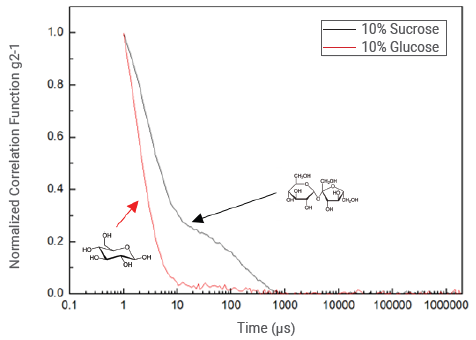
Figure 9. Normalized correlation functions for sucrose and glucose at a concentration of 10%. Image Credit: Bettersize Instruments
Figure 10 presents the normalized correlation functions of the 10% glucose and sucrose samples. The first decay of the correlation function for the glucose sample has a faster decay rate, which can be attributed to the smaller glucose molecule's greater diffusion rate.
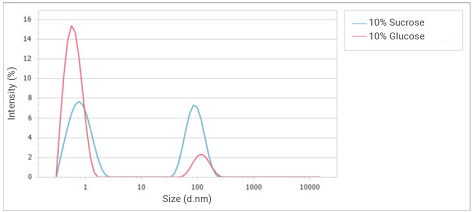
Figure 10. Overlay of intensity distributions of glucose and sucrose solution at a concentration of 10%. Image Credit: Bettersize Instruments
Comparing the size distribution of the 10% glucose and 10% sucrose solutions, as displayed in Figure 10, reveals a peak at approximately 1 nm for both samples. This peak is associated with the contribution of monosaccharides. An agglomerate peak near 100 nm is also observed, representing the contribution of polysaccharides.
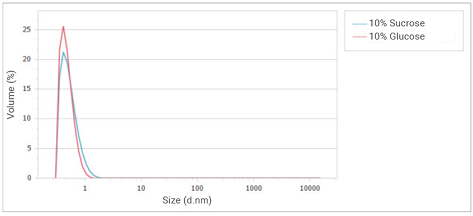
Figure 11. Overlay of volume distributions of glucose and sucrose solution at a concentration of 10%. Image Credit: Bettersize Instruments
Figure 11 illustrates the volume distribution curve, which suggests that the majority of the two samples in the solution contain extremely small monosaccharides, with low levels of polysaccharides
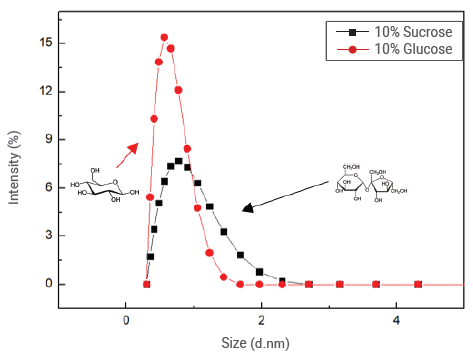
Figure 12. Magnified correlation functions for sucrose and glucose at a concentration of 10%. Image Credit: Bettersize Instruments
The monosaccharide peaks around 1 nm are magnified to further understand the differences in sizes of monosaccharides, and the coordinates are changed to linear coordinates in Figure 12.
The monosaccharide peaks in the glucose solution have a smaller size range than those in the sucrose solution due to the relatively smaller size of glucose molecules.
Conclusions
The study described in this article demonstrates the characterization of monosaccharide molecules' size and size distribution, specifically glucose. The BeNano, equipped with a high-speed correlator, was employed to measure glucose with a molecular weight of 180 Da.
Polystyrene spheres were utilized for viscosity correction, and measurements were obtained at various concentrations. The results exhibited distinct correlation functions and size distributions for glucose and sucrose samples, indicating the presence of monosaccharides and polysaccharides.
The results demonstrate the ability of the BeNano system to detect small particles such as glucose reliably.
Acknowledgments
Produced from materials originally authored by Zhibin Guo and Hui Ning from the Application Research Lab at Bettersize Instruments.

This information has been sourced, reviewed and adapted from materials provided by Bettersize Instruments.
For more information on this source, please visit Bettersize Instruments.