Edible oils are key nutrients for general health in our daily diet. To determine the quality of these important oils, there are various parameters, such as iodine value, free fatty acids (FFA), refractive index, and fatty acid composition, that can be applied.
The fatty acid profile offers a comprehensive view of the concentration of various fatty acids in the oil. Producers are particularly interested in the content levels of essential linoleic acid (C18:2) and alpha-linolenic acid (C18:3).
Conventional analysis techniques like titration or gas chromatography can pose health risks and increase laboratory costs as they often require hazardous solvents.
Conversely, The Metrohm NIRS DS2500 Liquid Analyzer can analyze all edible oil quality parameters via near-infrared spectroscopy (NIRS). This method helps boost productivity and limit costs, delivering quick results without sample preparation.
DS2500 Liquid Analyzer
The DS2500 Liquid Analyzer offers powerful near-infrared spectroscopy for quality control, not only in laboratories but also in production environments. The analyzer is a proven, dynamic solution for routinely analyzing liquids across the entire production line.
Its sturdy design makes the DS2500 Liquid Analyzer robust as it is resistant to dust, moisture, and vibrations, making it well-suited for deployment in harsh production environments outside of the laboratory.
The DS2500 covers the full spectral range from 400 to 2500 nm and delivers accurate, reproducible results in less than one minute. The DS2500 Analyzer addresses the demands of the pharmaceutical industry while supporting users in their daily routine tasks thanks to its intuitive operation.
Regardless of the sample type and challenges presented, a range of custom accessories help optimize the instrument’s functionality to ensure high-quality results are achieved from coarse-grained solids such as granulates to semi-solid samples such as creams. The MultiSample Cup can boost productivity when measuring solids, as it facilitates sequential automated measurements containing up to 9 samples.
Experimental Equipment
The Metrohm NIRS DS2500 Liquid Analyzer is used to analyze a total of 397 samples from various types of edible oils (including sunflower-, rapeseed-, sesame-, and soybean oil) as shown in Figure 1.
All measurements were conducted using transmission mode with 8 mm disposable vials. The analyzer’s temperature control function was calibrated to 40 °C for consistent measurement performance.
Iodine values were quantified using the fatty acid composition data acquired from an earlier gas chromatography analysis run. The software package Vision Air Complete was used to capture spectral data and develop the prediction model.
Source: Metrohm Middle East FZC
| Equipment |
Article number |
| DS2500 Liquid Analyzer |
2.929.0010 |
| DS2500 Holder 8 mm vials |
6.7492.020 |
| Vision Air 2.0 Complete |
6.6072.208 |
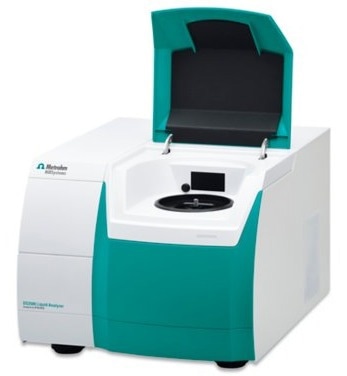
Figure 1. Metrohm NIRS DS2500 Liquid Analyzer used for the measurement of several quality control parameters in edible oils. Image Credit: Metrohm Middle East FZC
Result
The Vis-NIR spectra acquired were used to generate a prediction model to determine all eight parameters: iodine value, FFA, refractive index, palmitic acid (C16:0), stearic acid (C18:0), oleic acid (C18:1), linoleic acid (C18:2), and alpha-linolenic acid (C18:3).
Correlation diagrams were used for evaluating the quality of the prediction models which displayed a high correlation (R2 > 0.94) between the Vis-NIR prediction and the standard reference methods for all parameters.
The respective figures of merit (FOM) confirm the feasibility during routine analysis, displaying the expected precision as shown in Figures 3–10.
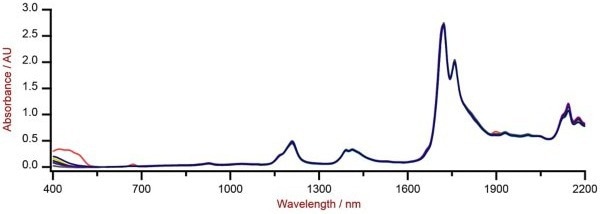
Figure 2. Selection of Vis-NIR spectra of edible oil samples analyzed on a Metrohm NIRS DS2500 Liquid Analyzer with 8 mm disposable vials. Image Credit: Metrohm Middle East FZC
Result Iodine Value
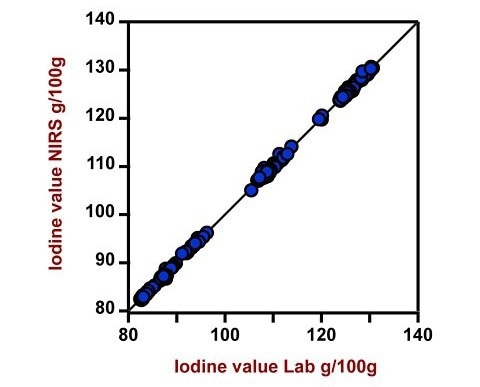
Figure 3. Correlation diagram and the respective figures of merit for the prediction of iodine value in edible oils using a DS2500 Liquid Analyzer. The lab value was measured using gas chromatography. Image Credit: Metrohm Middle East FZC
Source: Metrohm Middle East FZC
| Figures of Merit |
Value |
| R2 |
0.999 |
| Standard Error of Calibration |
0.29 g/100 g |
| Standard Error of Cross-Validation |
0.30 g/100 g |
Result Free Fatty Acids
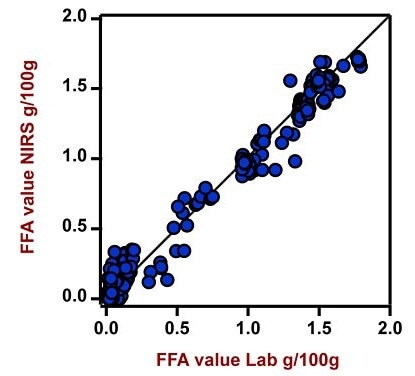
Figure 4. Correlation diagram and the respective figures of merit for the prediction of FFA value in edible oils using a DS2500 Liquid Analyzer. The lab value was measured using a titration method. Image Credit: Metrohm Middle East FZC
Source: Metrohm Middle East FZC
| Figures of Merit |
Value |
| R2 |
0.983 |
| Standard Error of Calibration |
0.08 g/100 g |
| Standard Error of Cross-Validation |
0.08 g/100 g |
Result Refractive Index
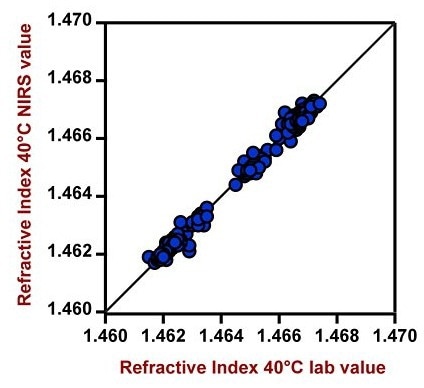
Figure 5. Correlation diagram and the respective figures of merit for the prediction of refractive index in edible oils using a DS2500 Liquid Analyzer. The lab value was evaluated using a refractometer. Image Credit: Metrohm Middle East FZC
Source: Metrohm Middle East FZC
| Figures of Merit |
Value |
| R2 |
0.996 |
| Standard Error of Calibration |
0.0001 |
| Standard Error of Cross-Validation |
0.0001 |
Result C16:0 Fatty Acid Content
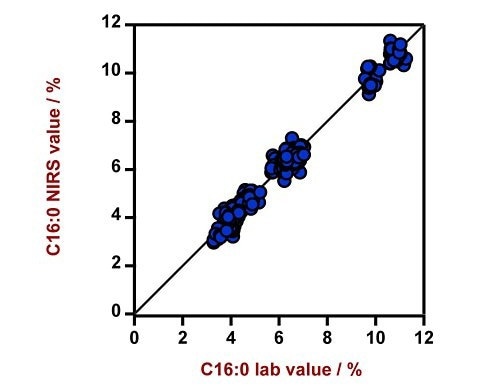
Figure 6. Correlation diagram and the respective figures of merit for the prediction of relative C16:0 fatty acid (palmitic acid) content in edible oils using a DS2500 Liquid Analyzer. The lab value was measured using gas chromatography. Image Credit: Metrohm Middle East FZC
Source: Metrohm Middle East FZC
| Figures of Merit |
Value |
| R2 |
0.980 |
| Standard Error of Calibration |
0.29% |
| Standard Error of Cross-Validation |
0.30% |
Result C18:0 Fatty Acid Content
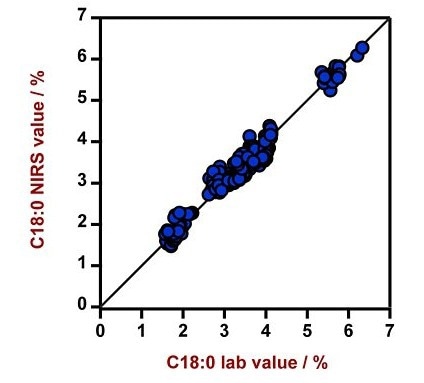
Figure 7. Correlation diagram and the respective figures of merit for the prediction of relative C18:0 fatty acid (stearic acid) content in edible oils using a DS2500 Liquid Analyzer. The lab value was measured using gas chromatography. Image Credit: Metrohm Middle East FZC
Source: Metrohm Middle East FZC
| Figures of Merit |
Value |
| R2 |
0.967 |
| Standard Error of Calibration |
0.18% |
| Standard Error of Cross-Validation |
0.18% |
Result C18:1 Fatty Acid Content
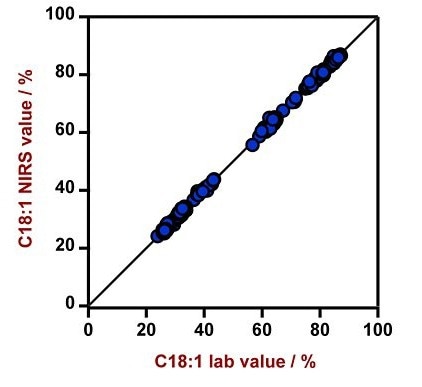
Figure 8. Correlation diagram and the respective figures of merit for the prediction of relative C18:1 fatty acid (oleic acid) content in edible oils using a DS2500 Liquid Analyzer. The lab value was measured using gas chromatography. Image Credit: Metrohm Middle East FZC
Source: Metrohm Middle East FZC
| Figures of Merit |
Value |
| R2 |
0.999 |
| Standard Error of Calibration |
0.57% |
| Standard Error of Cross-Validation |
0.62% |
Result C18:2 Fatty Acid Content
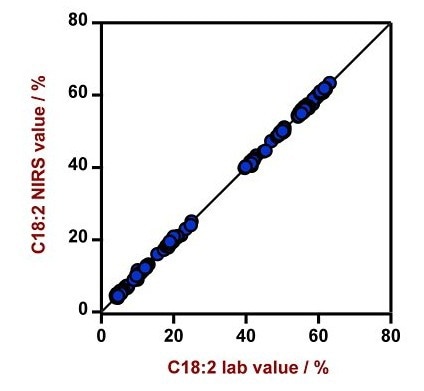
Figure 9. Correlation diagram and the respective figures of merit for the prediction of relative C18:2 fatty acid (linoleic acid) content in edible oils using a DS2500 Liquid Analyzer. The lab value was measured using gas chromatography. Image Credit: Metrohm Middle East FZC
Source: Metrohm Middle East FZC
| Figures of Merit |
Value |
| R2 |
0.999 |
| Standard Error of Calibration |
0.33% |
| Standard Error of Cross-Validation |
0.37% |
Result C18:3 Fatty Acid Content
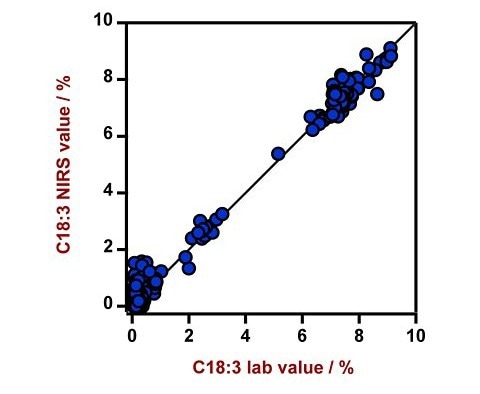
Figure 10. Correlation diagram and the respective figures of merit for the prediction of relative C18:3 fatty acid (alpha-linolenic acid) content in edible oils using a DS2500 Liquid Analyzer. The lab value was measured using gas chromatography. Image Credit: Metrohm Middle East FZC
Source: Metrohm Middle East FZC
| Figures of Merit |
Value |
| R2 |
0.990 |
| Standard Error of Calibration |
0.32% |
| Standard Error of Cross-Validation |
0.34% |
Conclusion
This article demonstrates the value and feasibility of near-infrared spectroscopy using the Metrohm NIRS DS2500 Liquid Analyzer for routine laboratory analysis of QC parameters of edible oils.
Compared to other traditional methods, Vis-NIR spectroscopy does not necessitate any sample preparation to acquire results. This helps reduce manufacturer’s workloads and associated costs (see Table 2).
Table 2. Time to result overview for the measurement of iodine value, FFA content, refractive index, and fatty acid composition in edible oils by standard analytical methods. Source: Metrohm Middle East FZC
| Parameter |
Method |
Time to result |
| Iodine value |
Gas Chromatography |
∼30 minutes per sample |
| FFA content |
Titration |
∼10 minutes per sample |
| Refractive index |
Refractometer |
∼2 minutes per sample |
| Fatty acid composition |
Gas Chromatography |
∼30 minutes per sample |

This information has been sourced, reviewed and adapted from materials provided by Metrohm Middle East FZC.
For more information on this source, please visit Metrohm Middle East FZC.