Sponsored by EntegrisReviewed by Olivia FrostMay 23 2024
The “tail” of a particle size distribution references the particles that are several standard deviations removed from the mean of the standard Gaussian distribution.
Figure 1 demonstrates the attributes of a Gaussian distribution where 95.5 % of the population is within plus or minus two standard deviations (σ) of the mean (µ). This can define the tails as being 2.25 % of the distribution outside of two standard deviations from the mean.
The larger, oversized particles to the far right of the distribution are within the coarse tail. These are often referred to as the “bad actors” that cause problems with either product quality or performance. The fine tails are the smaller particles to the far left of the distribution that can also cause issues in terms of product behavior, such as powder flow.
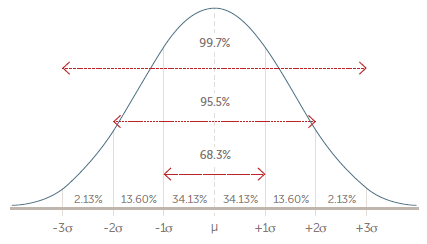
Figure 1. Gaussian distribution characteristics. Image Credit: Entegris
Although the word “tail” can be used to describe either the fine or coarse particles, it is most often used to describe the coarse outliers in a particle size distribution. These particles are frequently overlooked, missed, or misinterpreted by conventional light scattering particle sizing methods such as laser diffraction.
The single particle optical sensing (SPOS) method is the perfect choice for measuring the distribution tails. SPOS allows the measurement and counting of particles greater than 0.5 microns with precision and a higher resolution.
By measuring the distribution tail, the user can obtain data regarding whether or not an emulsion is stable or if a CMP slurry is likely to cause damage to the silicon wafers it is used to polish.
Pharmaceutical Emulsions
The correlation between emulsion stability and coarse droplets is already quite well understood.1,2,3 To determine the stability of lipid injectable emulsions, users are encouraged to follow the method outlined in USP.4
Method I indicates that the mean size must be below 500 nm, measured using either dynamic light scattering (DLS) or laser diffraction. Method II stipulates that the coarse tail (volume % greater than 5 µm) must be lower than 0.05 %, measured using the SPOS technique.
Figure 2 highlights the particle size distributions for two pharmaceutical emulsions: a new and very old intralipid sample. These two emulsions roughly have a similar mean diameter and would both pass the USP Method I criteria of less than 500 nm.
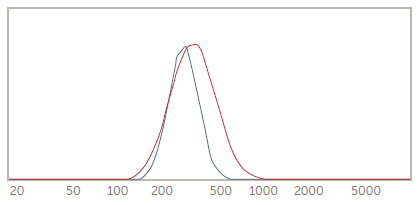
Figure 2. DLS results for old and new intralipid samples. Image Credit: Entegris
Method II of USP <729> focused on the large particle tail and the percentage of volume above 5 µm, as indicated in Figure 3. This tail concentration is a reliable predictor of a stable emulsion.
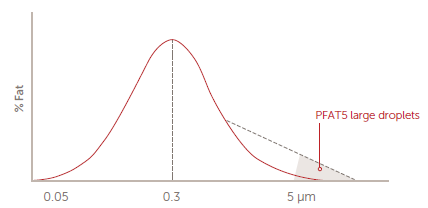
Figure 3. Coarse tail of an emulsion. Image Credit: Entegris
Taking the old and new intralipid results from Figure 2, two standard deviations from the mean would equal 389.1 and 532.4 nm. From the results, it was clear to see that the older sample had more coarse particles; however, DLS is unable to provide concentration information.
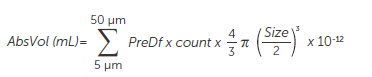
The SPOS technique, on the other hand, is able to determine the volume percent greater than 5 µm, also known as the PFAT5 value, with accuracy, even for highly concentrated emulsions. The equations that were used to determine the PFAT5 values are identified below.


SPOS results for new and old intralipid samples are shown in Figure 4, where the old sample has a higher concentration in the >5 µm range. The graph provides qualitative evidence for this, while the PFAT5 calculation provides the quantitative percentage value.
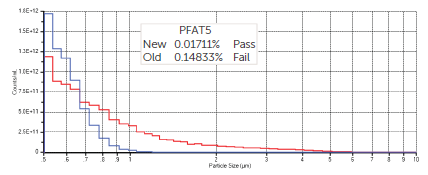
Figure 4. SPOS results for new and old intralipid samples. Image Credit: Entegris
Large Particle Counts in CMP Slurries
Chemical mechanical polishing/planarization (CMP) is a popular process utilized in microelectronic industries to smooth product surfaces by combining mechanical and chemical processes.
The particle size distribution of a slurry is an important factor that determines if the planarization process will be successful. The mean size of CMP slurries can be measured with DLS or laser diffraction.
A few large particles (large particle count, or LPC) can scratch the surface of wafers or disc drives, reducing yields and profits. Thus, the LPC, or tails, of CMP slurries are best measured using the SPOS technique.
To validate the sensitivity, accuracy, and resolution of results in the tail of the distribution, the sample should be spiked with a known amount of polystyrene latex (PSL) standard particles.
In one study,5 ceria Slurry C was diluted one part slurry to two parts DI water as used in the fab. The base slurry has a tail concentration of ~30,000 particles/mL >0.7 µm, and ~5,500 particles >0.7 µm were counted when testing 30 mL of sample for two minutes.
This slurry was then spiked by adding 35 µL of 1000 × diluted 1 µm PSL standard (concentration = 1.74×10⁷ particles/mL) to 250 mL of base slurry. This resulted in an estimated spike concentration of 2,500 particles/mL.
Figure 5 displays the outcomes for Slurry C both before and after the spike. This investigation validated the precision of the SPOS technique in reliably identifying additional LPC counts within the tail of the CMP particle size distribution.
Particle Concentration Differential Distribution
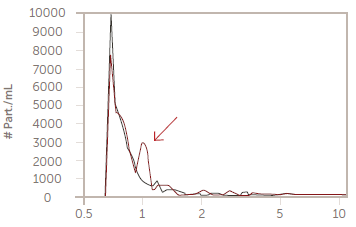
Figure 5. Slurry C before (blue) and after (red) spike. Image Credit: Entegris
Another study tested the LPC tail of a narrow colloidal silica CMP slurry with DLS to define the mean size of the distribution and then with SPOS to quantify the LPC tail. Figure 6 details the mean size distribution of the slurry measured by DLS.
Gaussian Summary:
Mean diameter = 79.0 nm
Standard deviation = 7.3 nm (9.2%)
Volume-Weight Gaussian Distribution
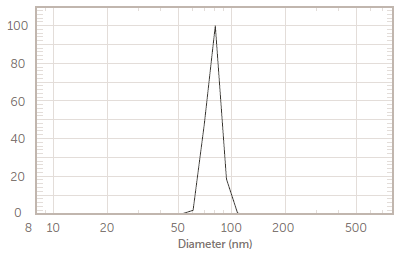
Figure 6. Size distribution of colloidal silica by DLS. Image Credit: Entegris
Two standard deviations from the mean are (7.3 × 2) + 79 = 93.6 nm or 0.094 µm. In this sample, zero counts greater than 0.5 µm would be likely. Therefore, using a SPOS instrument with a lower detection limit to quantify the tail of this distribution was required.
The result detailed in Figure 7 highlights a liquid particle count for the sample greater than 0.15 µm or 150 nm. As anticipated, no counts were greater than 0.5 µm.
Population Differential Distribution
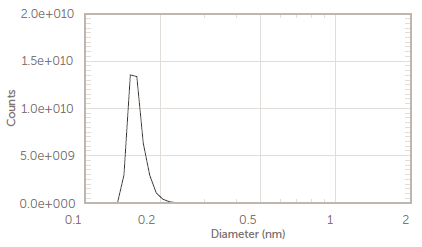
Figure 7. LPC count for colloidal silica by SPOS. Image Credit: Entegris
Tails in Inkjet Inks
Inkjet inks are colloidal dispersals of pigments in solution with mean sizes significantly below 1 µm. Clogged jets, reduced performance and low image quality are risks associated with oversized particle tails. SPOS is frequently used to measure the concentration of large particles in inkjet inks.
A commercial sample of black inkjet ink was analyzed with DLS to discover the mean size and zeta potential.6 The sample was diluted 1000:1 in deionized (DI) water and a short study was completed to confirm that the size was not altered by the additional dilution. The mean size, as measured by the DLS system, is exhibited in Figure 8.
Particle Size Analysis
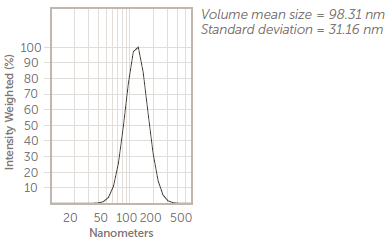
Figure 8. Mean size of ink by DLS. Image Credit: Entegris
In the sample, the volume mean = 98.31 nm and the standard deviation = 31.16. The two standard deviations from the mean are (31.16 × 2) = 98. 31 = 160.63 nm.
The assumption was that few particles greater than 0.5 µm would be in the distribution. However, a significant concentration of coarse tail particles was found with testing on an SPOS system using two different pre-dilution levels, as demonstrated in Figure 9.
Note that the actual concentration > 0.5 µm is over 10,000 particles/mL, which proves that the SPOS method was highly effective for quantifying the concentration of this tail.
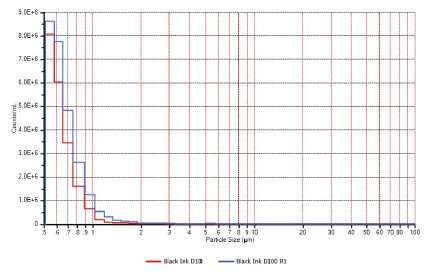
Figure 9. Inkjet ink tail by SPOS. Image Credit: Entegris
As the concentration of oversized particles is vital for inkjet inks, the sample may be filtered to minimize the presence of oversized particles. The before and after filtration results of a magenta inkjet ink are demonstrated in Figure 10. Here, the SPOS technique proved ideal for optimizing filter selection for inkjet inks.
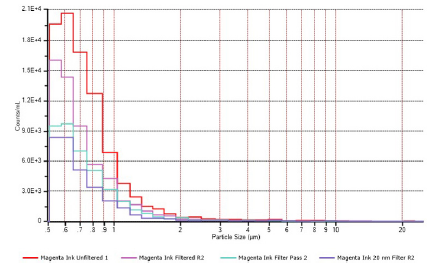
Figure 10. Before and after filtration by SPOS. Image Credit: Entegris
Detecting Fines
There are numerous applications and industries where the tail of small particles (the fines) is a vital issue. For instance, small particles can affect packing density and powder flow. SPOS can precisely quantify the concentration of fines while providing increased accuracy and higher resolutions than laser diffraction.
The quantity of fines in additive manufacturing (AM), or 3-D printing, is a vital component in the production of parts and the final product’s quality.7-9
A selection of powder samples utilized in AM were analyzed using both SPOS and laser diffraction to determine the capability of each method in establishing the population of fine particles.10 Figure 11 details SPOS results for polymethyl methacrylate (PMMA) polymer for number and volume distributions.11
Figure 12 demonstrates the same PMMA sample analyzed with a laser diffraction analyzer. The X-axis scale is similar for all graphs. See reference 10 for details on preparing and analyzing the sample.
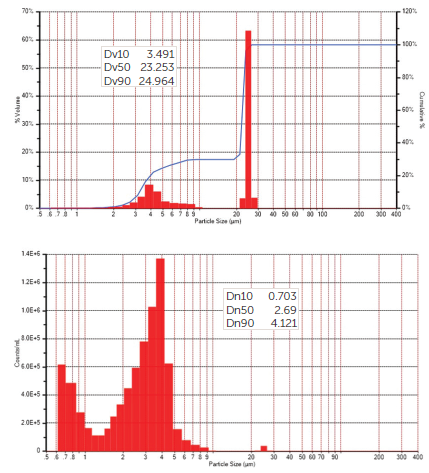
Figure 11. SPOS results for PMMA; volume above, number below. Image Credit: Entegris
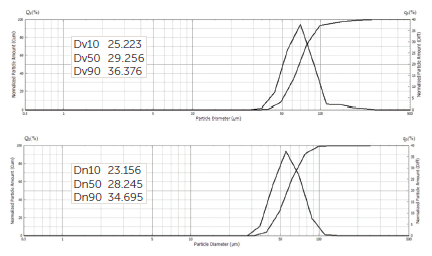
Figure 12. Laser diffraction results for PMMA, volume above, number below. Image Credit: Entegris
The laser diffraction analyzer provided no useful information on the quantity of fines, while the SPOS results quantifiably defined the significant proportion of fines. Using the equations below, the SPOS technique can also calculate the absolute volume fraction within any size range.
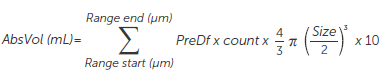
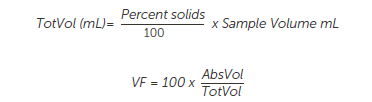
Additionally, the total number of particles within any size range can be determined by creating defined size regions and viewing the statistics with the region, as highlighted in Figure 13.
Figure 13. SPOS result with region statistics. Image Credit: Entegris
Conclusions
The tails of particle size distributions can have a considerable impact on the performance and quality of a product. Ensemble light scattering methods like DLS and laser diffraction can be useful and valuable analytical tools. However, they cannot produce precise, high-resolution concentration information for tails of particle size distributions.
The SPOS method is the best choice for quantifying coarse and fine tail distributions. An extensive selection of applications and industries utilize it for this reason.
References and Further Reading
- Driscoll, D. et al., Physicochemical assessments of parenteral lipid emulsions: light obscuration versus laser diffraction, International Journal of Pharmaceutics 219 (2001) 21–37
- Driscoll, D., Globule-size distribution in injectable 20% lipid emulsions: Compliance with USP requirements, Am J Health-Syst Pharm—Vol 64 Oct 1, 2007
- Driscoll, D. et al., Pharmacopeial compliance of fish oil-containing parenteral lipid emulsion mixtures: Globule size distribution (GSD) and fatty acid analyses, International Journal of Pharmaceutics 379 (2009) 125–130
- USP <729> Globule Size Distribution in Lipid Injectable Emulsions
- Entegris Application Note “Detecting Tails in CMP Slurries”
- Entegris Application Note “Particle Size of Inkjet Inks”
- Spierings A.B., Herres N., Levy G. Influence of the particle size distribution on surface quality and mechanical properties in AM steel parts. Rapid Prototype. J. 2011; 17:195–202. Doi: 10.1108 /13552541111124770.
- Liu B., Wildman R., Tuck C., Ashcroft I., Richard H. Investigation the effect of particle size distribution on processing parameters optimization in Selective Laser Melting process; Proceedings of the 22nd Solid Freeform Fabrication Symposium; Austin, TX, USA. 8–10 August 2011; pp. 227–23
- Spurek, M., Haferkamp, L., Weiss, C. et al. Influence of the particle size distribution of monomodal 316L powder on its flowability and processability in powder bed fusion. Progress in Additive Manufacturing 7, 533–542 (2022)
- Entegris Application Note “Importance of Particle Size in Powders Used for Additive Manufacturing”
- Entegris White Paper “Particle Size Analysis Overview”

This information has been sourced, reviewed and adapted from materials provided by Entegris.
For more information on this source, please visit Entegris.