Thermally activated delayed fluorescence (TADF), otherwise known as E-type delayed fluorescence, was first observed in 1924 by Francis Perrin.1,2
In 2012, it saw a resurge of attention, including wider spread exposure, when Professor Chihaya Adachi and associates at Kyushu University utilized the TADF mechanism for harvesting triplet excitons in organic light-emitting diodes (OLEDs) and created a novel type of high-efficiency OLED that has no requirement for heavy metals.3
Since then, TADF has become a highly popular method for harvesting triplet excitons in OLEDs. Intensive research efforts spanning both academic and industrial sectors are now dedicated to advancing new TADF emitters with robust stability and desirable color properties.
The Triplet Exciton Issue
OLEDs are a very popular display type for televisions and smartphones, as they offer higher contrast ratios and lower power consumption than traditional LCD displays. OLEDs comprise layers of carbon-based organic semiconductors which are placed between two electrodes and electrons.
Holes are then injected into the organic semiconductor under an applied bias. When they meet, the holes and electrons form Coulombically bound electron-hole duos called excitons, which recombine to create light.
As per spin statistics, approximately 25 % of the excitons formed will reside in the singlet state (S1), while the remaining 75 % will be in the triplet state (T1).
In the initial OLED designs utilizing fluorescent molecular emitters, only the S1 state exhibited emissive properties. This was because the T1 to S0 radiative transition was prohibited, primarily due to the conservation of spin angular momentum.
Consequently, these first-generation OLEDs were constrained to a maximum internal quantum efficiency (IQE) of 25 %.
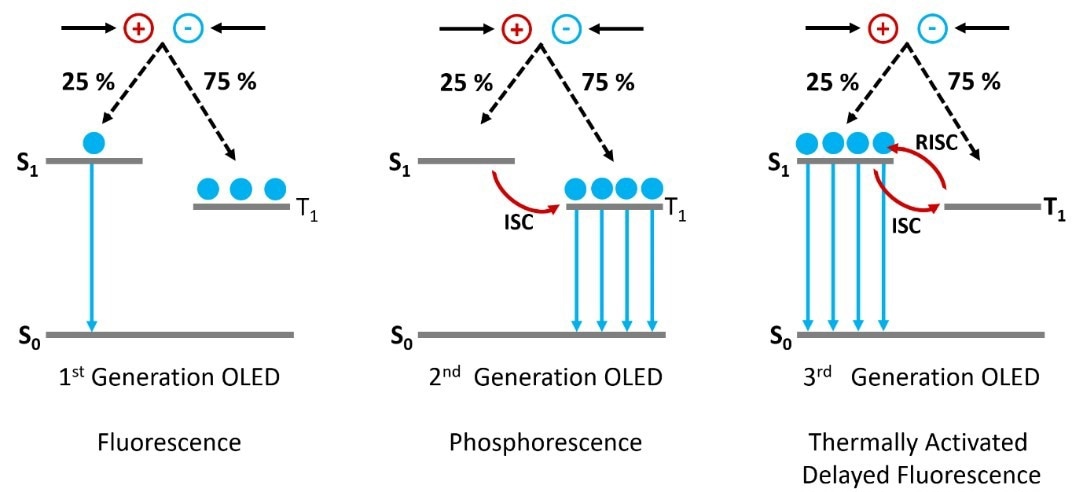
Figure 1. The operating mechanisms behind 1st, 2nd and 3rd generation OLEDs. Image Credit: Edinburgh Instruments Ltd.
Heavy metals such as platinum and iridium were integrated into the molecular emitters to develop second-generation phosphorescent OLEDs to address this constraint.
The inclusion of heavy metals in the molecule enhances the spin-orbit coupling between the spin angular momentum and the orbital angular momentum, thereby enabling the T1 to S0 radiative transition.
This approach enables IQEs of 100 % to be achieved; however, heavy metals do have their drawbacks.
These metals are rare and expensive and are, therefore, impracticable for high production volumes. Additionally, phosphorescent OLEDs exhibit poor stability, especially in the blue spectrum. Despite efforts, a stable deep blue phosphorescent emitter has yet to be discovered.
Third-Generation TADF OLEDs
Due to the abovementioned limitations, there has been a push to develop heavy metal-free third-generation OLEDs that function using the TADF mechanism.
In a TADF emitter, the S1 and T1 states are intentionally engineered to be close in energy and strongly coupled. This configuration facilitates excitons generated in the T1 state to undergo a thermally assisted reverse intersystem crossing (RISC) to the S1 state.
They are then able to radiatively degrade to the S0, which results in delayed fluorescence emission (Figure 1). The TADF mechanism enables IQEs of 100% without the use of heavy metals.
New TADF emitters with high photoluminescence quantum yields, excellent stability, and optimal color coordinates for displays are thus a must. During the process of creating these emitters, it is crucial to thoroughly characterize their emission properties. This information is then utilized to fine-tune subsequent molecular designs.
This article will delve into the FS5 Spectrofluorometer's ability to provide a thorough characterization of TADF emitters. It will achieve this by investigating the recently published OLED emitter CzDBA (Figure 2) and confirming the presence of TADF emission.4
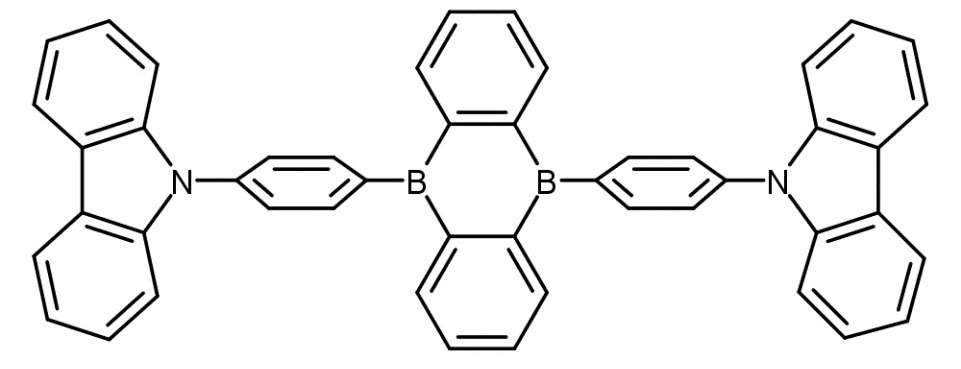
Figure 2. Chemical structure of the CzDBA TADF emitter.4 Image Credit: Edinburgh Instruments Ltd.
Materials and Methods
CzDBA was dissolved in anhydrous toluene at a concentration of 2x10⁵ M. The solution was then degassed utilizing freeze-pump-thaw, and the cuvette was backfilled with nitrogen to prevent oxygen ingress.
Photoluminescence and absorption measurements were taken using the FS5 Spectrofluorometer equipped with a PMT-900 detector, a 150 W Xenon lamp, multichannel scaling (MCS) lifetime electronics, a 5 W microsecond Xe flashlamp, and a 375 nm picosecond pulsed diode laser (EPL-375).
Room temperature measurements were conducted using the SC-25 Thermoelectric Cuvette Holder Module, whereas cryogenic measurements employed the SC-70 Liquid Nitrogen Dewar Module. The SC-30 Integrating Sphere Module was utilized to measure the photoluminescence quantum yield (PLQY) of CzDBA.
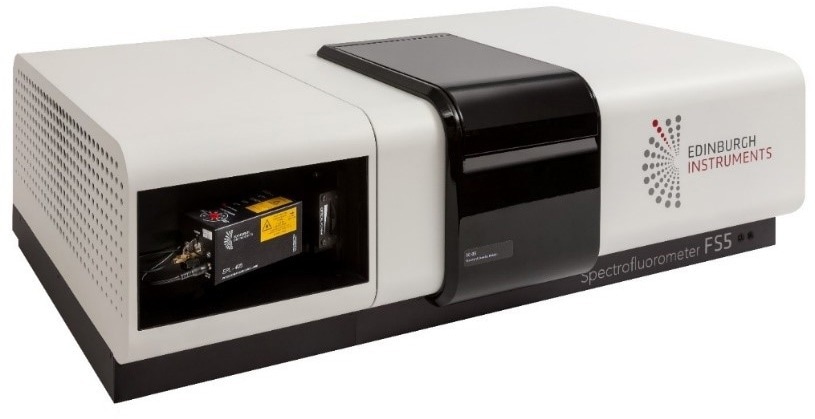
Figure 3. FS5 Spectrofluorometer. Image Credit: Edinburgh Instruments Ltd.
Results and Discussion
Absorption and Emission Spectra
The first step in characterizing a TADF emitter is to accurately determine its absorption and emission spectra. The FS5 Spectrofluorometer contains a standard transmittance detector that enables absorption and emission spectra to be measured using a single instrument (Figure 4).
The absorption spectrum of CzDBA exhibits maxima at 290 nm and 340 nm, extending with a long tail up to 500 nm. On the other hand, the emission spectrum is broad and lacks distinct features, with a peak emission at 550 nm and a full width at half maximum (FWHM) of 95 nm. This corresponds to color coordinates of 0.37 and 0.58 in the CIE 1931 color space.
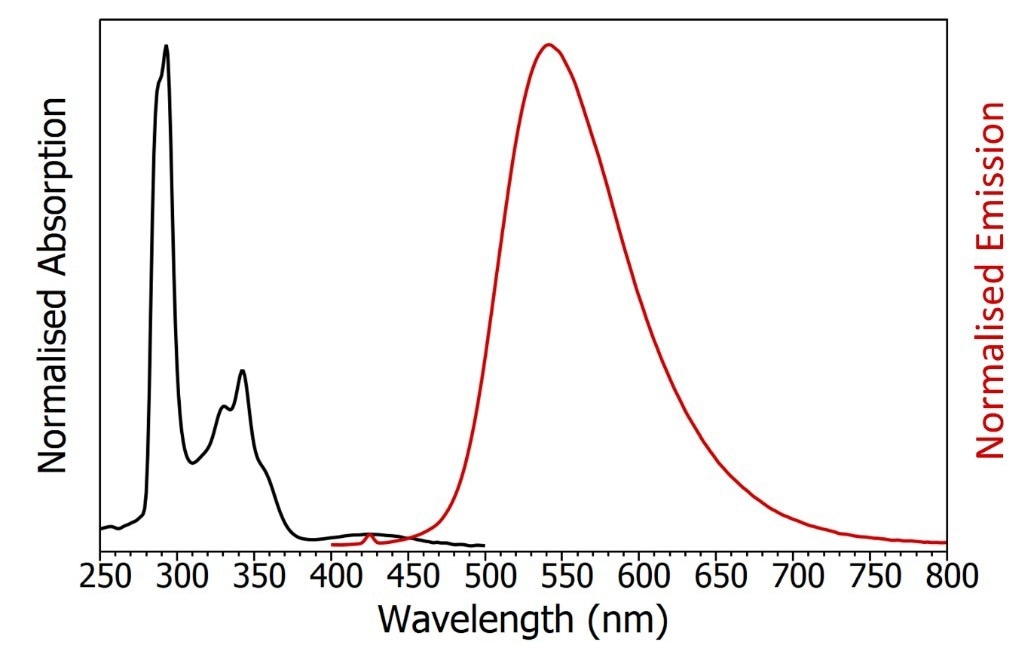
Figure 4. Absorption (black) and emission (red) spectra of degassed CzDBA in toluene. The small peak in the emission spectrum at 425 nm is the Raman scatter from the solvent. Absorption parameters: Δλex = 2 nm. Emission parameters: λex = 375 nm, Δλex = 2 nm, Δλex = 2 nm. Image Credit: Edinburgh Instruments Ltd.
Oxygen Quenching of the Photoluminescence Quantum Yield
An initial assessment for the presence of TADF emission involves measuring the PLQY both in the absence and presence of oxygen. In TADF processes, RISC from the T1 state plays a crucial role.
Any mechanism that depletes the population from the T1 state will consequently reduce the intensity of TADF emission. Due to its triplet ground state, molecular oxygen readily depletes population from the T1 state through energy transfer and quench the TADF emission.
The change in emission intensity when the CzDBA solution is introduced to oxygen is shown in Figure 5. The SC-30 Integrating Sphere Module of the FS5 was used to measure photoluminescence quantum yields.
When the solution is exposed to oxygen, there is a 50 % reduction in quantum yield, suggesting that the T1 state is part of the emission process and an initial indicator that the emission may contain TADF.
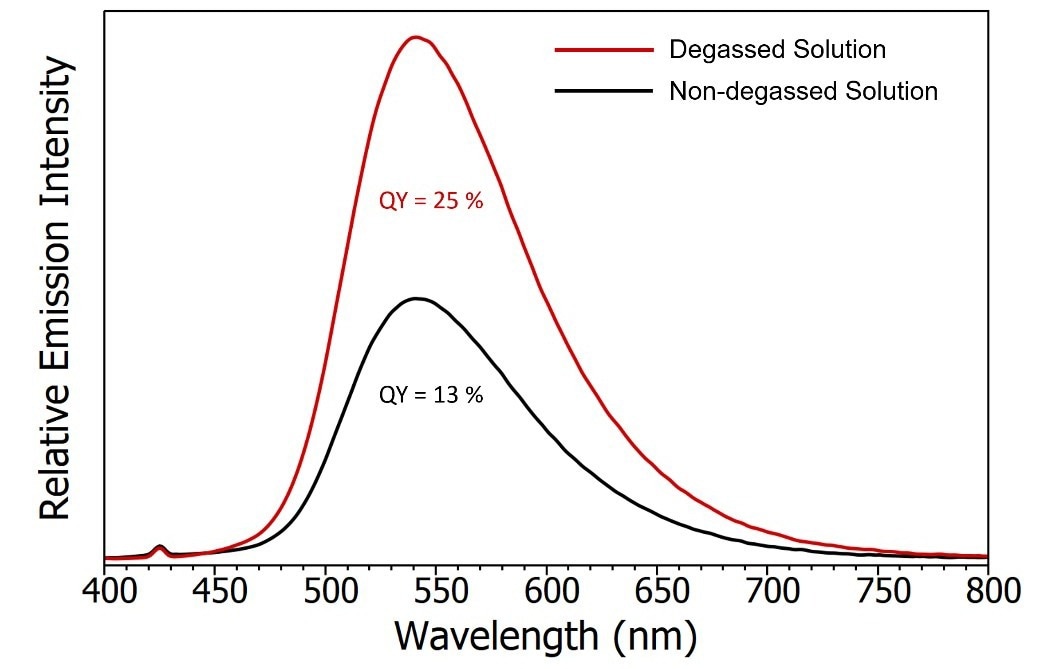
Figure 5. Emission spectra of degassed CzDBA solution (red) and non-degassed CzDBA (black). The quantum yield of the non-degassed solution was measured using the SC-30 Integrating Sphere module and the degassed quantum yield was extrapolated based on the relative intensity of the emission. Experimental parameters: λex = 375 nm, Δ ex = 5 nm , Δλem = 0.5 nm. Image Credit: Edinburgh Instruments Ltd.
Emission Decay
To definitively confirm the presence of TADF, the temporal response of the emission must be measured. The FS5 can be enhanced with lifetime counting electronics, flashlamps, and a diverse selection of pulsed diode lasers and LEDs to facilitate the measurement of fluorescence, delayed fluorescence, and phosphorescence of materials.
The emission decay of CzDBA was measured by exciting the solution with a pulsed diode laser and measuring the decay using multichannel scaling single photon counting (MCS) (Figure 6).
MCS is a complementary time-resolved technique to the widely recognized time-correlated single photon counting (TCSPC).
While TCSPC is preferred for acquiring rapid fluorescence decays at high laser excitation rates, it can be very slow when dealing with long emissions (>μs) and requires the excitation rate to be lowered. This is because TCSPC mandates that the detection count rate remains below 5 % of the excitation rate.
In MCS acquisition, the detection window is divided into time intervals, and all photons arriving within a specified interval are counted. This process continues for subsequent intervals until the entire time range is covered.
This multiple-stop mode detection allows for higher detection count rates compared to TCSPC. As a result, MCS reduces the acquisition time for longer decays and is, therefore, the preferred method for measuring delayed fluorescence.
The FS5 seamlessly transitions between TCSPC and MCS acquisition modes using the Fluoracle software. This flexibility enables the selection of the optimal detection method for the desired time scale.
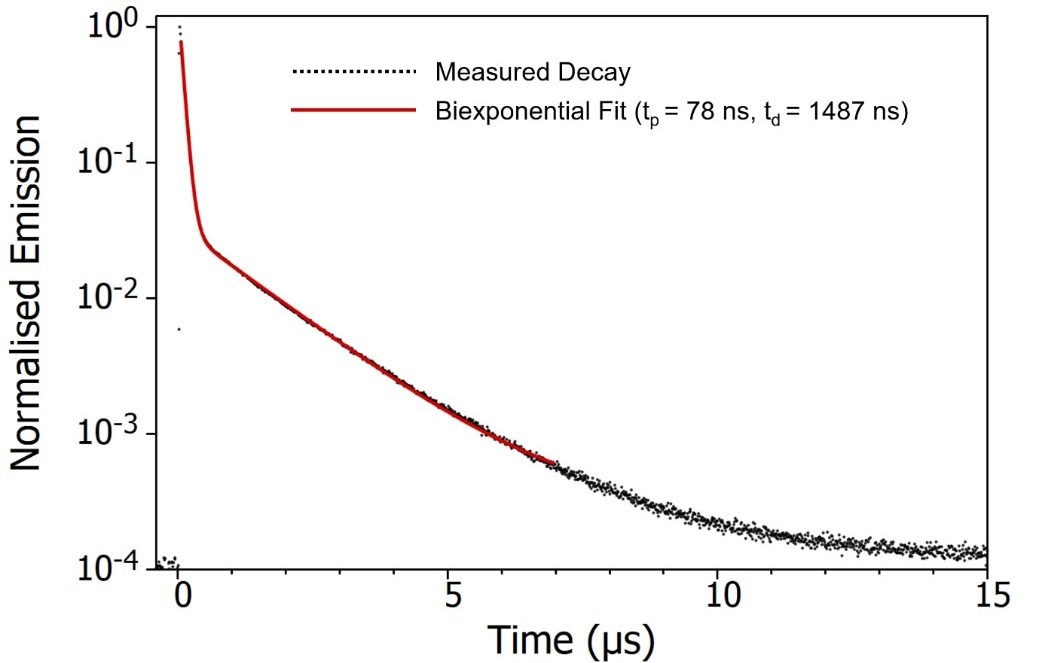
Figure 6. Emission decay of degassed CzDBA solution measured using MCS. Experimental Parameters: Source = EPL-375, Rep Rate = 50 kHz, λex = 375 nm, λem = 550 nm, Δλem = 20 nm. Image Credit: Edinburgh Instruments Ltd.
The decay of CzDBA emission displays a distinctive biexponential pattern, consisting of a prompt component with a lifetime of 78 ns and a delayed component with a lifetime of 1487 ns.
The prompt component can be unequivocally attributed to fluorescence arising from the S1 à S0 transition (Figure 7). The delayed component could either be delayed S1 à S0 fluorescence following repopulation of the S1 through RISC from the T1, or direct T1 à S0 phosphorescence.
Based solely on the emission's time scale, it is challenging to definitively differentiate between these mechanisms.
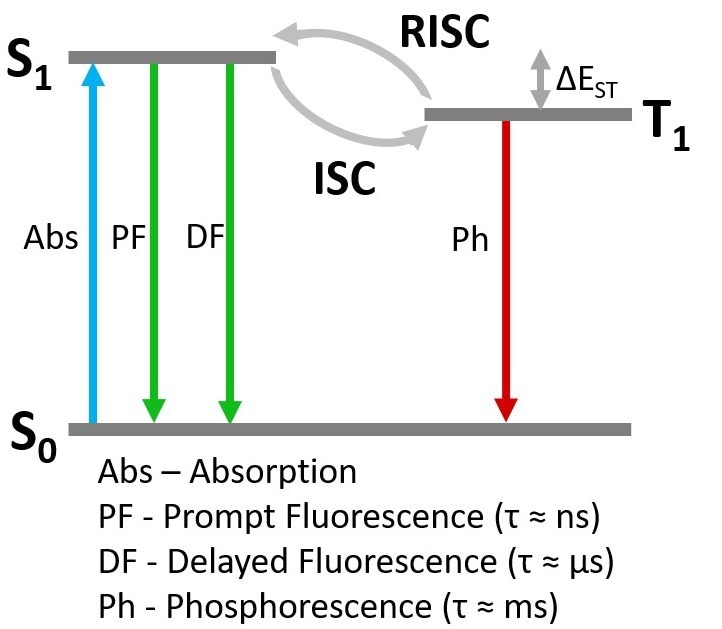
Figure 7. Simplified Jablonski Diagram of TADF photophysics. Image Credit: Edinburgh Instruments Ltd.
Time-Resolved Emission Spectrum (TRES)
One way to determine whether the origin of the delayed component is delayed fluorescence or phosphorescence is by comparing the spectral shape of the prompt and delayed components by acquiring a time-resolved emission spectrum (TRES).
In a TRES measurement, , the emission decay is recorded as a function of emission wavelength, resulting in a three-dimensional time-resolved spectrum (see Figure 8a). The TRES data can then be sliced to produce a snapshot of the emission spectrum at a specific time following the laser pulse.
Figure 8b exhibits two TRES slices showcasing the characteristics of the prompt component (100 ns after the flash) and the delayed component (4 μs after the flash).
The spectra of the prompt and delayed components appear identical, implying that the delayed component likely represents delayed fluorescence since phosphorescence from the T1 state would occur at a longer wavelength than the fluorescence due to the lower-lying energy of the T1 state.
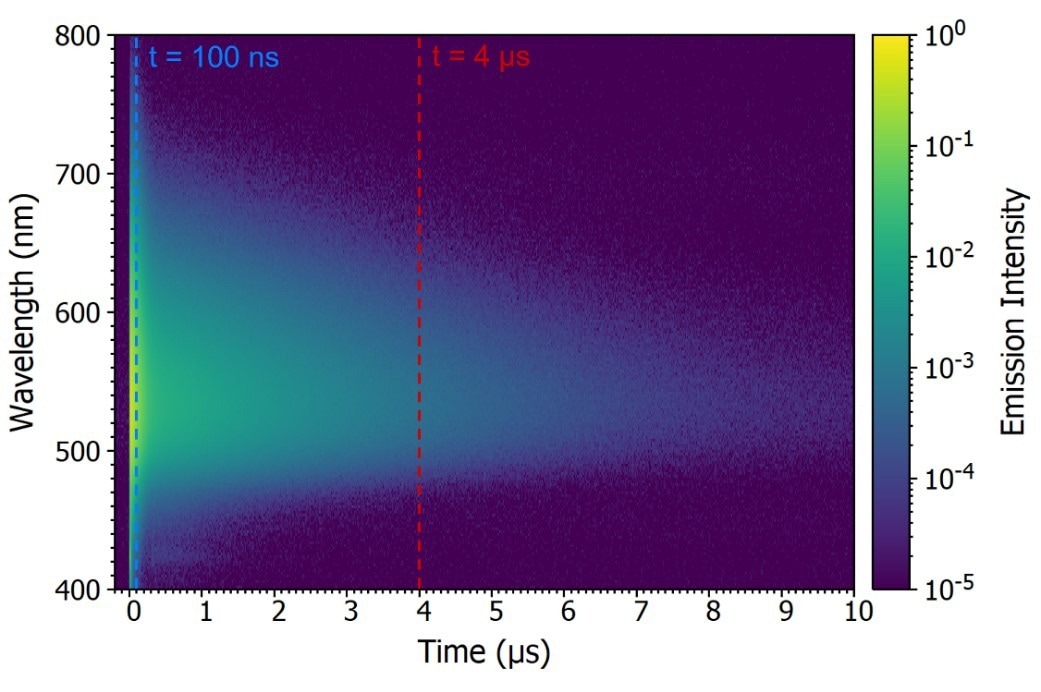
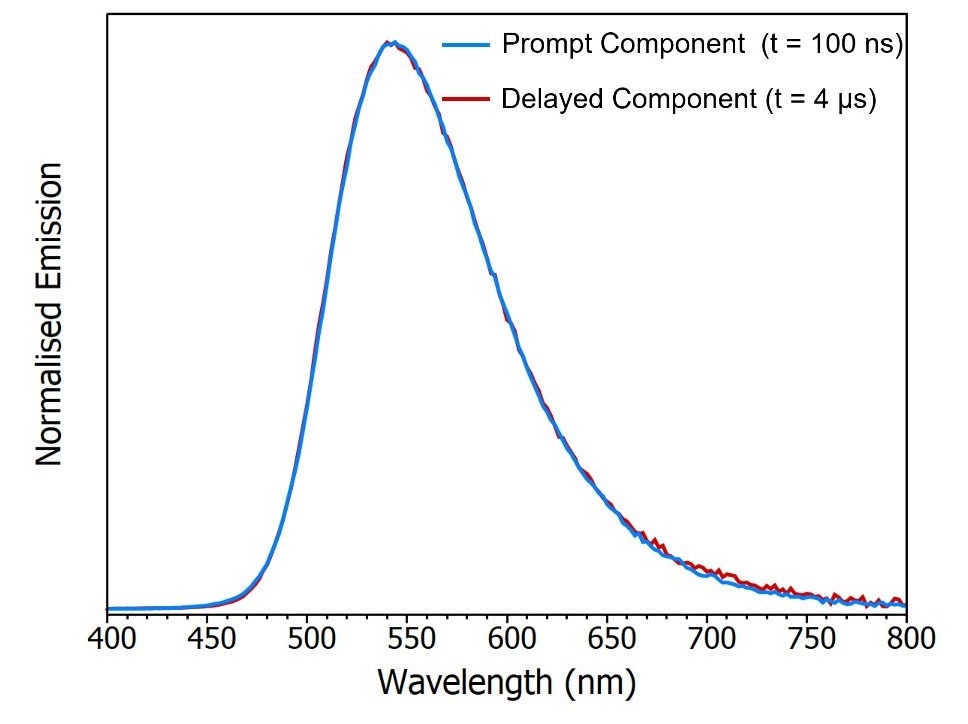
Figure 8. Time-resolved emission spectrum (TRES) of CzDBA solution measuring using MCS. TRES color map (a) and TRES slices (b) of the prompt and delayed emission. Experimental Parameters: Source = EPL-375, Rep Rate = 50 kHz, λex = 375 nm, Δλem = 10 nm. Image Credit: Edinburgh Instruments Ltd.
Temperature Dependence of the Emission Decay
The second method to determine the origin of the delayed component is measuring the temperature dependence of the decay. The FS5 can be equipped with a range of thermoelectric cuvette holders, heating stages, and cryostat, which allow measurements to be carried out over a temperature range of ‑196 °C (77 K) to 600 °C (873 K).
The emission decays of CzDBA at both 77 K and 300 K were measured utilizing the SC-80 Liquid Nitrogen Dewar Module, as illustrated in Figure 9.
Figure 9a clearly indicates a notable suppression of the delayed component when the sample is cooled to 77 K. This observation strongly suggests that the delayed component arises from a thermally activated process.
The decays were also monitored over a longer timescale utilizing the microsecond Xe flashlamp for excitation (Figure 9b) to seek out longer-lived millisecond phosphorescence emission.
Interestingly, the long-lived phosphorescence demonstrated an opposing trend, being present at 77 K but suppressed when the sample was warmed to 300 K.
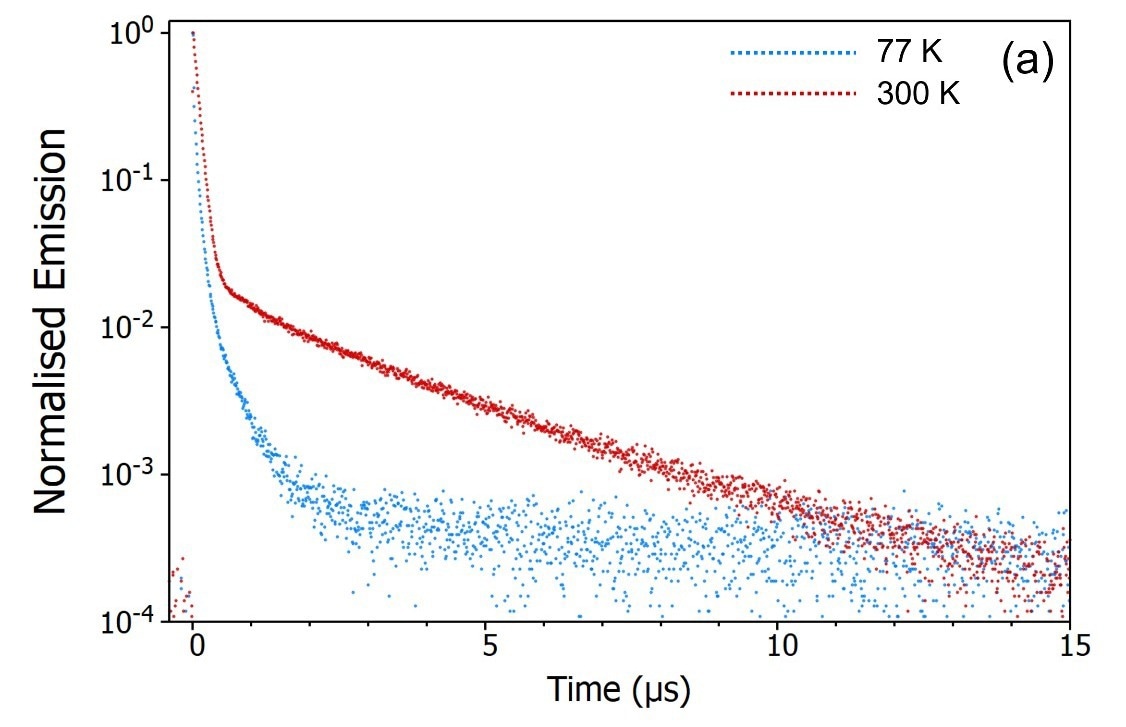
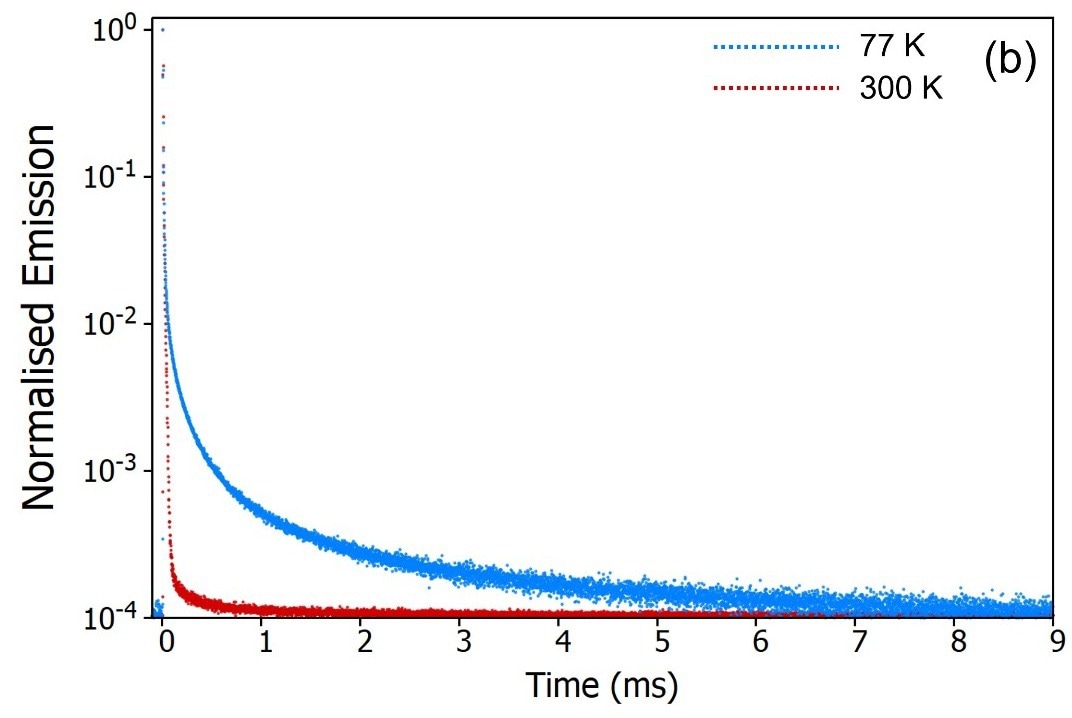 Figure 9. Variation of the delayed fluorescence intensity (a) and phosphorescence intensity (b) with temperature. Experimental Parameters (a): Source = EPL-375, Rep Rate = 50 kHz, λex = 375 nm, λem = 550 nm, Δλem = 10 nm. Experimental Parameters (b): Source = μs Xe Flashlamp, Rep Rate = 100 Hz, λex = 375 nm, Δλex = 2 nm, λem = 550 nm, Δλem = 2 nm. Image Credit: Edinburgh Instruments Ltd.
The temperature-dependent decays confirm the assignment of the delayed component as thermally activated delayed fluorescence. At 300 K, the molecule possesses adequate thermal energy to overcome the energy gap, ΔEST, between the S1 and the T1.
RISC continues, leading to the repopulation of the S1 state, giving rise to delayed fluorescence and the depopulation of the T1 state suppresses the phosphorescence.
When the sample is cooled to 77 K the opposite occurs: the molecule lacks sufficient thermal energy to surpass ΔEST, thereby deactivating RISC. This results in suppressed delayed fluorescence and enhanced phosphorescence.
Conclusion
The absorption and emission characteristics of CzDBA were examined utilizing the FS5 Spectrofluorometer, which confirmed the presence of TADF emission.
This article explored how the FS5 can be used for the investigation of TADF emitters, characterizing the absorption, emission, quantum yield and lifetime of new emitters in a single compact instrument.
Acknowledgments
Produced from materials originally authored by Dr. Tien-Lin Wu and Prof. Chien-Hong Cheng at National Tsing Hua University, Taiwan.
References
- F. Perrin, La fluorescence des solutions, Ann. Phys. 12 169–275 (1929)
- B. Valeur, M. N. Berberan-Santos, Introduction, Molecular Fluorescence: Principles and Applications, 2nd Ed. Wiley-VCH 01-25 (2012)
- H. Uoyama, K. Goushi, K. Shizu, H. Nomura and C. Adachi, Nature, 492, 234–238 (2012)
- T. -L. Wu, M. -J. Huang, C.-C. Lin, P.-Y. Huang, T.-Y. Chou, R.-W. C.-H. Chen, H.-W. Lin, R.-S. Liu & C.-H.Cheng, Nat. Photonics 12 235-240 (2018)

This information has been sourced, reviewed and adapted from materials provided by Edinburgh Instruments Ltd.
For more information on this source, please visit Edinburgh Instruments Ltd.