The FS5 Spectrofluorometer with an NIR InGaAs detector measures emission spectra up to 1650 nm. Absorption and emission spectra of PbS quantum dots are measured with the FS5. Solvent absorption in the NIR can distort emission spectra, making the right choice of solvent critical.
Introduction
Near-infrared emitting (NIR) semiconductor quantum dots (QDs) have adaptive attributes and high photoluminescence quantum yields. An advantage of biological imaging is synthesizing probes with emission and absorption wavelengths in the NIR region.
Firstly, this prevents damaging the biological tissues, a fundamental problem with UV region fluorophores. Secondly, the wavelengths are ideal in surgical applications due to increased tissue penetration, and finally, there is an increase in spatial resolution.1,2
The commercially available series of NIR-emitting QDs include lead sulphide (PbS) QDs. Their adaptive emission attributes are regulated by capping with amphiphilic molecules. This assists in the stabilization of the small-sized nanoparticles and prevents uncontrolled growth.3
QDs are often dispersed in a study solution to identify these materials. QDs are often hydrophobic and require organic solvents for dispersal. The NIR absorption of organic solvents can impede the emission of the sample. For this application, the photoluminescence spectra of NIR PbS quantum dots were measured in three organic solvents utilizing the FS5 Spectrometer equipped with an NIR InGaAs detector.
Materials & Methods
PbS QDs were obtained from Quantum Solutions. The dispersions were formulated using tetrachloroethylene (PCE) (anhydrous, Sigma), dichloromethane (DCM) (Uvasol®, Merck), and toluene (anhydrous, Sigma) with an absorbance of ~0.1 at the excitation wavelength of 670 nm. The samples were packed inside 10 mm pathlength 4-sided cuvettes.
The DS5 UV-Vis Spectrophotometer was utilized to measure absorbance. For emission spectra, the FS5 Spectrofluorometer equipped with a 150 W Xe arc lamp and an InGaAs-1650 NIR detector (NIRA+ upgrade) was used for the measurements (Figure 1). The Cuvettes were contained in a SC-05 Standard Cuvette Holder Module.
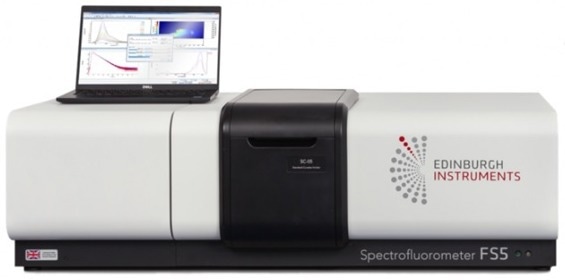
Figure 1. Edinburgh Instruments FS5 Spectrofluorometer. Image Credit: Edinburgh Instruments Ltd.
Absorption & Emission Spectra of PbS
Measurements of the absorption and emission of PbS QDs were obtained with the DS5 and FS5. The DS5 provides a greater absorption range of 1100 nm. This allows the NIR absorption peak of PbS in PCE to be noted (Figure 2).
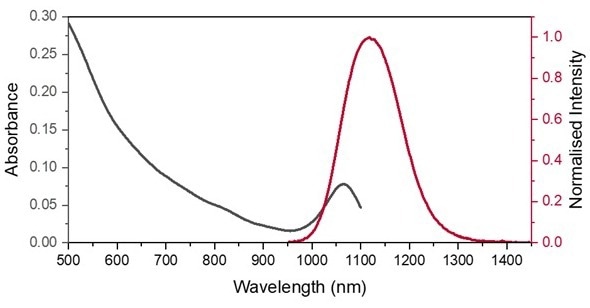
Figure 2. Absorption spectrum of PbS QDs in PCE measured on the DS5 from 500-1100 nm (black). Normalized emission spectrum of PbS QDs in PCE (red), excited at 670 nm. Image Credit: Edinburgh Instruments Ltd.
The absorption of PbS in PCE demonstrates a wide clear absorption band up to 950 nm and a narrow NIR absorption band centered at 1050 nm. The longer wavelength absorption band overlaps the emission band of PbS QDs in PCE.
The small Stokes shift between the absorption and emission NIR peaks produces a high proportion of spectral overlap, as demonstrated in Figure 2. This can result in reabsorption that decreases emissions on the rising spectra edge, causing spectral distortion. This is a common feature in NIR emitters requiring the correct concentration levels to minimize the effect.
Influence of the Solvent on the PbS Emission Spectrum
QDs can be dispersed in a variety of organic solvents. The effect the solvent has on the emission spectra was investigated by suspending the same QDs in toluene and DCM. The standardized spectra results are demonstrated in Figure 3 highlighting how important the choice of solvent is for measuring the emission spectra in the NIR.
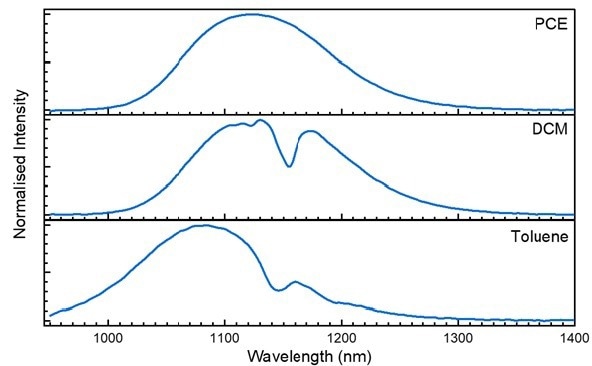
Figure 3. Emission spectra of PbS QDs in PCE (top), DCM (middle), and toluene (bottom) excited at 670 nm. Image Credit: Edinburgh Instruments Ltd.
Solvent interactions shift emission peaks. Toluene shifts to a shorter wavelength than seen in PCE and DCM. The greater effects are the depressions in the emission peaks directly resulting from the toluene and DCM solvent molecules absorbing the PbS emission.
Numerous common solvents contain absorption bands that can affect the sample emission profile in the NIR. Determining the solvent’s attributes is a crucial step during the collection of emissions in the NIR region.4
Conclusion
The FS5 Spectrofluorometer measures the emission spectra up to 1650 nm when equipped with the InGaAs-1650 NIR detector (NIRA+ upgrade). Common solvents like DCM and toluene have absorption bands above 1000 nm, potentially obstructing the emission spectrum of the NIR-emitting sample. The solvent’s ability to effect measurements like quantum yield is difficult because the solvent’s absorption is required to obtain precise quantum yield value.
References and Further Reading
- Y. Imamura, S. Yamada, S. Tsuboi, Y. Nakane, Y. Tsukasaki, A. Komatsuzaki and T. Jin, Near-infrared emitting PbS quantum dots for in vivo fluorescence imaging of the thrombotic state in septic mouse brain, Molecules, 2016, 21, 1-12.
- M. Asha Krishnan, K. Yadav, P. Roach and V. Chelvam, A targeted near-infrared nanoprobe for deep-tissue penetration and imaging of prostate cancer, Biomatter Sci, 2021, 9, 2295–2312.
- S. Gulati, M. Sachdeva and K. K. Bhasin, in AIP Conference Proceedings, AIP, 2018, p. 030214.
- R. Hoshi, K. Suzuki, N. Hasebe, T. Yoshihara and S. Tobita, Absolute Quantum Yield Measurements of Near-Infrared Emission with Correction for Solvent Absorption, Anal Chem, 2020, 92, 607–611.

This information has been sourced, reviewed and adapted from materials provided by Edinburgh Instruments.
For more information on this source, please visit Edinburgh Instruments.