This article is based on a poster originally authored by Rui Santos, Oliver Buettel, Peio Riss, and Maximiliam Schussler.
The PlasmaQuant MS, an innovative ICP-MS, and Speedwave XPERT, a microwave sample preparation system was used to analyze multielement and rare earth elements (REEs) in complex soil, ore, and sediment specimens. The main goal was to create a methodology capable of addressing these industries' analytical challenges while demonstrating the equipment's capabilities.
Researchers want comprehensive multielement and REE analyses for challenging matrices like ore, soil, and sediment. Due to their heterogeneity and potential for interference, these specimens must be prepared diligently. Key factors for precise quantifying include detection limits, sensitivity, and eliminating matrix effects. Overcoming these challenges is critical to obtaining reliable data from various environmental and geological specimens.
The system combines PlasmaQuant MS, an innovative ICPMS, and Speedwave XPERT, a specialized microwave sample prep system. PlasmaQuant MS provides the precision and sensitivity required for multielement analysis with integrated collision/reaction cell tech. Speedwave XPERT speeds up specimen preparation and optimizes recovery while reducing contamination.
This integration improves workflow, productivity, and data reliability. Due to the advanced features of PlasmaQuant MS and Speedwave XPERT, researchers can perform reliable and accurate multielement and REE analyses in ores, soils, and sediments. These tools guarantee the integrity of the data collected from geological exploration, mining operations, and environmental monitoring.
 Download the Poster
Instrumentation and Accessories
The analytical work was completed utilizing the PlasmaQuant MS Elite S with the integrated collision/reaction cell (iCRC) technology to remove polyatomic species created in the plasma while improving the accuracy and precision of sample testing.
The ICP-MS system was installed on a CETAC ASX-560 autosampler, a CETAC ASXPlus injection valve, a Scott-type spray chamber with a Peltier chiller, and a Seaspray® nebulizer. Figure 1 demonstrates how the equipment quantified 60 elements in the four Certified Reference Materials of soil and sediments.
H3BO3 neutralized the HF during the dissolution, eliminating the need for an “inert” (HF-resistant) sample introduction kit. Instead, the standardized glass/quartz sample introduction system was utilized. The soil specimens were dissolved in the closed-container microwave-assisted SpeedWave XPERT system. The PlasmaQuant MS determined the content of the chosen metals and metalloids in the prepared solutions. The experiments were all completed in a routine analytical laboratory and were not performed in ‘clean room’ conditions.
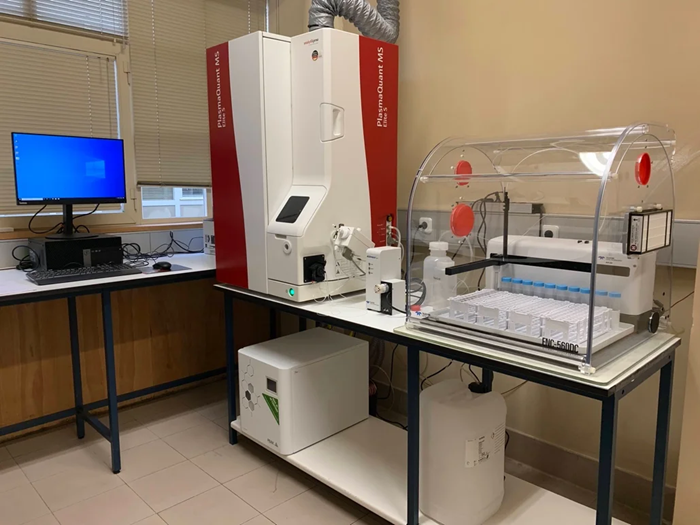
Figure 1. PlasmaQuant MS Elite S and the accessories. Image Credit: Analytik Jena US
Instrument and Method Parameters
Table 1 shows the instrument operating parameters, including iCRC modes that used helium and hydrogen gases to eliminate spectroscopic interference to the first-row transition metals.
Table 1. Instrument settings – PlasmaQuant MS. Source: Analytik Jena US
| Parameter |
Specification |
| Plasma Gas Flow |
9.0 L/min |
| Auxiliary Gas Flow |
1.50 L/min |
| Sheath Gas Flow |
0.00 L/min |
| Nebulizer Gas Flow |
1.07 L/min |
| Sampling depth |
6.0 mm |
| Plasma RF Power |
1.40 kW |
| Ramp Rate |
20 rpm – black/black PVC pump tubing (<1 mL/min) |
| Stabilization delay |
10 s |
| iCRC Gas Setting in mL/min |
He 120 mL/min: 31P, 49Ti, 71Ga, 74Ge and REE |
| He 150 mL/min: 27Al, 44Ca, 45Sc, 51V, 52Cr, 55Mn, 59Co, 60Ni, 65Cu, 66Zn and 125Te |
| No Gas: 7Li, 9Be, 23Na, 24Mg, 39K, 85Rb, 86Sr, 89Y, 90Zr, 93Nb, 98Mo, 107Ag, 111Cd, 115In, 118Sn, 121Sb, 133Cs, 137Ba, 178Hf, 181Ta, 182W, 185Re, 201Hg, 205Tl, 206,7,8Pb, 209Bi, 232Th and 238U |
| H2 150 mL/min: 57Fe, 75As and 78Se |
| Dwell Time |
10 ms (No Gas) and 30 ms (iCRC) |
| Scan per Replicate |
20 (peak hopping, 1 pt/peak) |
| No. of Replicates |
3 |
| Sample uptake time |
0 s – ASXPlus Sample Introduction system used |
| Internal Standards |
103Rh and 193Ir at 25 μg/L, interpolate correction |
Sample Preparation
Four Certified Reference Materials of soil and sediments were formulated in triplicate for method verification purposes. Two were from the National Institute of Standards & Technology, Gaithersburg, MD 20899, USA (NIST 1646a and NIST 2711a), and two were supplied by the China National Analysis Center for Iron and Steel, Beijing, China (NCS DC 73319a and NCS DC 73325).
Following Table 2 settings, every solid sample was placed into a pre-cleaned SpeedWave XPERT dissolution system container and mixed with the reagent (s). The solutions were made up to 50 mL with 0.5M HNO3 according to the two-step digestion. They were then diluted twofold with DI H2O before undergoing ICP-MS analyses. The finalized acid concentrations were as follows: 8% (v/v) HNO3, 4% (v/v) HCl, 1% (v/v) H2O2, and 0.4% (w/v) H3BO3.
The 2% (v/v) HF included in the digestion mix was neutralized by adding H3BO3. The concentration of total dissolved solids (TDS) in the final digests analyzed was approximately 0.17% (1700 ppm), including sediment matrix (~0.1%) and boron (0.07%).
It is important to note that specimens with up to 0.3% TDS are inside the limits routinely handled by the PQMS without additional aerosol dilution. Each soil/sediment CRM was spiked following the two-step microwave dissolution procedure. The final concentration of each spiked element ranged from 0.25 to 250 ppb, depending on the anticipated concentration for each element.
Table 2. Digestion methods parameters used by SpeedWave XPERT microwave digestion system. Source: Analytik Jena US
| Parameter |
Specification |
| Sample amount |
0.1 g dried and sieved |
| H2O |
Few drops |
| HCl |
4 mL |
| HNO3 |
8 mL |
| HF 1 |
mL |
| H2O2 |
1 mL |
| Vessel |
PM60 |
| Temp. / Ramp / Hold |
200 ºC / 15 min / 20 min at 1200 W |
| Cooling / Time |
Room / 30 min |
| Boric acid |
10 mL of 4% (w/v) |
| Temp. / Ramp / Hold |
170 ºC / 25 min / 20 min at 1000 W |
| Cooling / Time |
Room / 30 min |
| Final volume |
Fill up to 50 mL with 0.5M HNO3 |
| Centrifuged |
3500 rpm / 5 min |
| ICP-MS prior dilution |
1:2 with 1% (v/v) HNO3 |
Results
Figure 2 illustrates the exceptional performance of the four certified reference materials tested. Recovery rates were between 80% and 120%, indicating exceptional accuracy. However, some elements were inconsistent, causing their rates to exceed this range.
The variations were low overall, at below 5%. Some elements close to the detection limits presented slightly higher variations of approximately 5-15%. However, all the measurements of the different concentrations were accurate and precise, supporting the method's effectiveness.
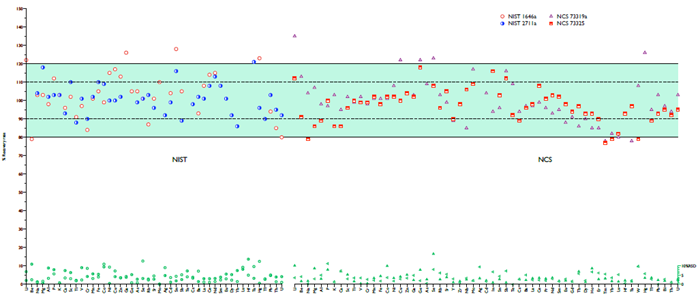
Figure 2. Recovery rate (%) and precision (%RSD) of four CRMs. Image Credit: Analytik Jena US
Internal Standards Stability
For this investigation, 145 solutions were analyzed over 7.5 hours. Two elements, 103Rh and 193Ir, were utilized for internal standards. Figure 3 illustrates how well the internal standards performed with recovery measurements within ±30%.
Recoveries within 20% highlight the PlasmaQuant MS's extraordinary tolerance when used for various specimen types like soils, ores, and sediments. This tolerance provided consistent signals from sample to sample, minimized matrix effects, and prevented considerable buildup on the interface throughout the sequence.
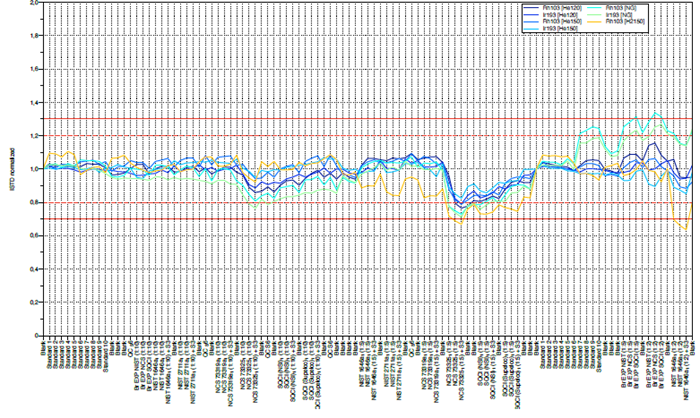
Figure 3. Internal standards stability over a 7h 30 run. Image Credit: Analytik Jena US
Download the Poster

This information has been sourced, reviewed and adapted from materials provided by Analytik Jena US.
For more information on this source, please visit Analytik Jena US.