Vibrational spectroscopy is a high-performance analytical technique commonly used in chemistry, materials science, biology, and environmental research.
Infrared spectroscopy (IR) is the most widespread vibrational spectroscopy. It can be further categorized into near-infrared (NIR) spectroscopy (12,800 to 4000 cm-1), mid-infrared (mid-IR) spectroscopy (4000 to 400 cm-1), and far-infrared (far-IR) spectroscopy (400 to 10 cm-1).
Raman spectroscopy is another technique in the vibrational spectroscopy family. This technique involves molecules scattering monochromatic light, producing energy shifts that correspond to vibrational transitions. Each form of vibrational spectroscopy presents distinct advantages and constraints, and Table 1 summarizes their comparative techniques.
Selection of the most suitable technique depends on sample type, experimental parameters, and specific data requirements. A system that integrates all these techniques within a unified platform offers highly valuable versatility, enabling comprehensive sample analysis with increased confidence.
Table 1. Vibrational Spectroscopy Techniques: Information Provided and Sampling Considerations. Source: Thermo Fisher Scientific - Vibrational Spectroscopy
| Information |
Sampling Considerations |
| Mid-IR |
|
- Strong fundamental vibrations (stretching and bending).
- Sensitivity to polar bonds and functional groups
- Large number of libraries available
- Information available for Identification and characterizing compounds
|
 Transmission, reflection, and ATR modes are available. Transmission, reflection, and ATR modes are available.
Sensitive – Mid-IR can be used to analyze thin samples.
 ATR is a surface technique and requires sample contact. ATR is a surface technique and requires sample contact.
Transmission requires specialized windows.
Excessively thick samples can be over-absorbing. |
| Far-IR |
|
- Probes intermolecular interactions and low-frequency vibrations
- Limited spectral interpretation & libraries
- Primarily used for analyzing the lattice dynamics and structural properties of materials, such as polymorphs, minerals, and crystalline solids
|
Transmission, reflection, and diamond ATR are available.
ATR requires sample contact
Limited window choices exist for far-IR.
Water vapor causes large interferences (purge is important). |
| Near-IR |
|
- Broad, overlapping combination bands and overtones
- Can require chemometrics for analysis
- Often used for quantitative analysis of bulk properties, such as physical characteristics, moisture content, and chemical composition
|
Sampling through glass
Greater penetration, allowing for thicker samples
Good reflection data
Fiber optics options
Weaker peaks (not ideal for thin samples) |
| FT-Raman |
|
- Sharp peaks based on fundamental vibrations
- Sensitive to non-polar bonds (based on polarizability)
- Emphasizes different structural aspects
- Low-frequency peaks are standard with Raman
|
Sampling through glass
No sample preparation: just focus on the sample.
Mostly a surface technique
Small analysis spot size
Sample heating & fluorescence can be issues. |
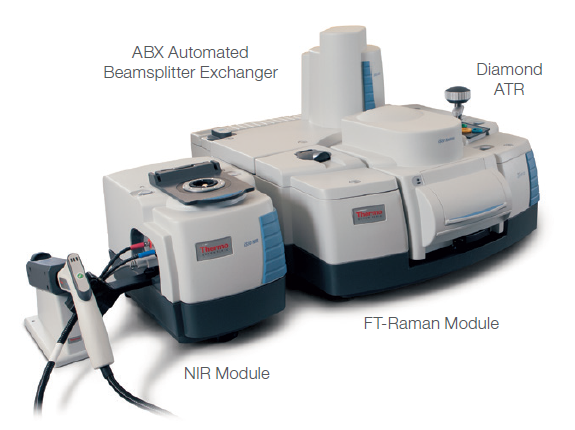
Image Credit: Thermo Fisher Scientific - Vibrational Spectroscopy
The Thermo Scientific™ Nicolet™ iS50 FTIR Spectrometer offers seamless access and smooth transition between mid-IR, near-IR (NIR), far-IR, and FT-Raman within one instrument.
- The FT-Raman module, located in the sample compartment, employs a 1064 nm laser to generate Raman spectra and features a motorized stage for mapping applications.
- The integrated diamond ATR features a dedicated detector with a diamond window, allowing access to both mid-IR and far-IR spectra.
- The near-IR module is equipped with an integrating sphere and access to fiber optics.
- Automated switching of beamsplitters, detectors, and sources accommodates various modes.
This article investigates the use of multiple forms of vibrational spectroscopy by analyzing acetaminophen polymorphs. Polymorphs are different crystalline forms of the same chemical substance, each exhibiting distinct crystal structures that result in different vibrational modes and frequencies.
Acetaminophen, a commonly utilized antipyretic and analgesic drug, exists in several polymorphic forms that have been thoroughly investigated.1 The most prevalent and thermodynamically stable form of acetaminophen is the monoclinic Form I, which is widely used in commercial solid pharmaceutical formulations.
Two orthorhombic forms (II and III), though thermodynamically unstable, can be produced via thermal (melts) and solution (recrystallization) techniques. Figure 1 provides an overview of the different techniques utilized in this study for synthesizing these polymorphic forms. Vibrational spectroscopy was utilized to confirm the various forms of acetaminophen.
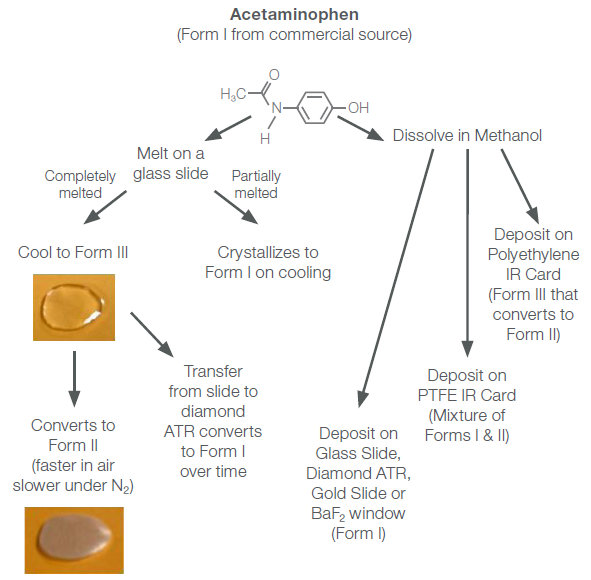
Figure 1. Routes to produce different polymorphic forms of acetaminophen. Image Credit: Thermo Fisher Scientific - Vibrational Spectroscopy
ATR Mid-IR (4,000 – 400 cm-1)
Figure 2 presents the mid-IR spectra of acetaminophen Forms I, II, and III utilizing the integrated diamond ATR. Form III displays noticeable differences compared to the other two forms, with a number of its peaks appearing broader and less defined.
The differences between Form I and Form II are subtle but discernible upon closer inspection, particularly in the highlighted spectral regions. A prominent peak at 682 cm-1 is evident in Form I but not in Form II.
The peaks in the region 1270-1200 cm-1, resulting from C-O and/or C-N stretching; and 1680-1585 cm-1, ascribed to the amide bonds, display unique patterns for Forms I and II. Additionally, some peaks in Form II are shifted to higher frequencies.
For instance, the peak at 3162 cm-1 in Form I, attributed to hydrogen-bonded O-H stretches, is shifted to 3207 cm-1 in Form II.2
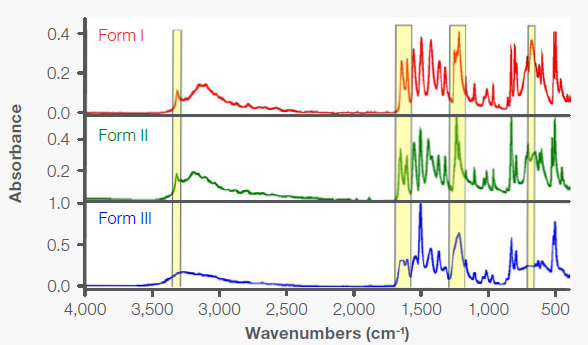
Figure 2. Mid-IR diamond ATR spectra of Forms I, II, and III. The regions highlighted in yellow show the difference between the spectra. Image Credit: Thermo Fisher Scientific - Vibrational Spectroscopy
Transmission Mid-IR (4,000-400 cm-1)
These polymorphs can also be analyzed via transmission mid-IR spectroscopy. Figure 3 demonstrates the transmission IR spectrum obtained by depositing acetaminophen from a methanol solution on a polyethylene (PE) IR card. Following the subtraction of the PE contributions, the resulting spectrum was compared with the ATR spectra (Figure 2) to verify the presence of Form II.
Notably, when the methanol solution of acetaminophen was deposited onto a PE IR card, acetaminophen was initially in Form III, but gradually converted to Form II. The conversion process was complete after approximately 400 minutes.
Figure 4 displays the peak area profiles monitoring the Form III → Form II conversion via a time series. Initially, as demonstrated by the spectrum at T2, acetaminophen was mostly in Form III, but at T425, acetaminophen was almost entirely in Form II.
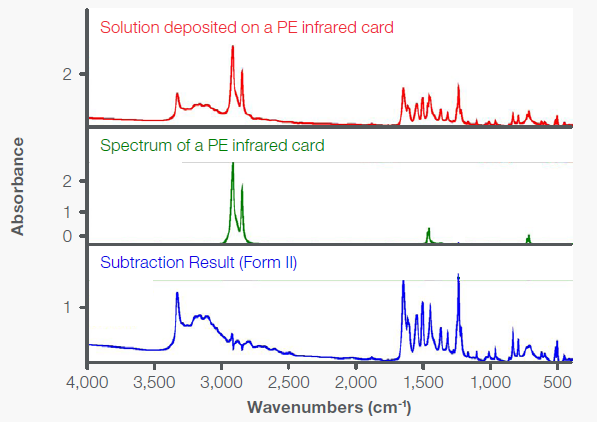
Figure 3. Mid-IR transmission spectra for a methanol solution of acetaminophen deposited on a PE IR card, a blank PE card, and the subtraction result (Form II). Image Credit: Thermo Fisher Scientific - Vibrational Spectroscopy
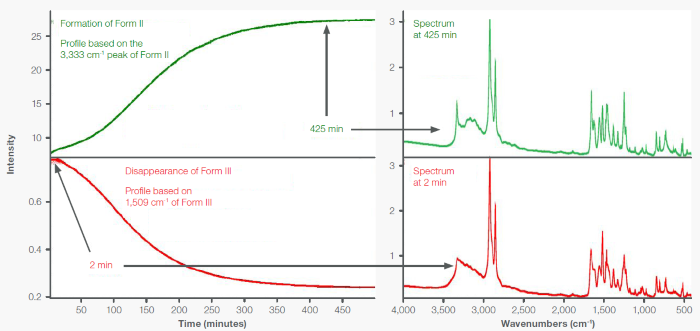
Figure 4. Times series peak area profiles showing the transformation of Form III to Form II for material deposited on a PE Card. Spectra are from 2 minutes (Form III) and 425 minutes (Form II). Image Credit: Thermo Fisher Scientific - Vibrational Spectroscopy
Far-IR Transmission (600-100 cm-1)
Far-IR is especially beneficial for analyzing polymorphs because it can probe molecule lattice vibrations. Far-IR can be conducted as a transmission experiment. Due to its far-IR transparency, PE is frequently utilized for supporting samples (windows, pellets) and detector windows.
The far-IR transmission spectra of Forms I, II, and III on PE cards are displayed in Figure 5. The spectra vary in both frequency and relative intensity. The most notable difference is that the 217 cm-1 peak in Form I appears at 189 cm-1 in Form II.3 Although Form III exhibits a peak at 225 cm-1 , the overall spectrum differs significantly from Form I.
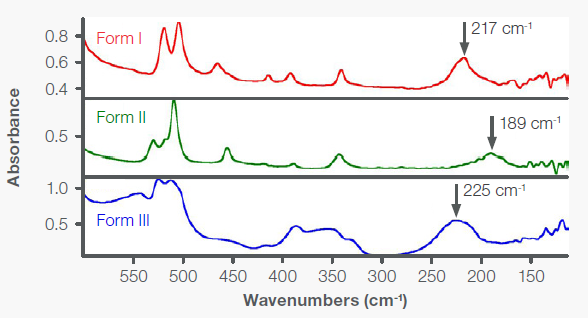
Figure 5. Far-IR transmission spectra of Forms I, II, and III of acetaminophen on PE IR cards. Image Credit: Thermo Fisher Scientific - Vibrational Spectroscopy
Far-IR ATR (1,800-100 cm-1)
Water vapor peaks can interfere with the far IR region, complicating transmission far-IR. To overcome this challenge, the iS50’s integrated diamond ATR and a dedicated detector featuring diamond windows is an effective alternative. Diamond is transparent across both mid-IR and far-IR regions.
Moreover, this ATR inside the instrument ensures a highly stable atmosphere, mitigating the water vapor interference. Figure 6 displays the far-IR spectra of Forms I, II, and III using the integrated diamond ATR. The spectra include the far-IR region (400-100 cm-1 ) and part of the mid-IR region (1800-400 cm-1 ) where the diamond causes no interference.
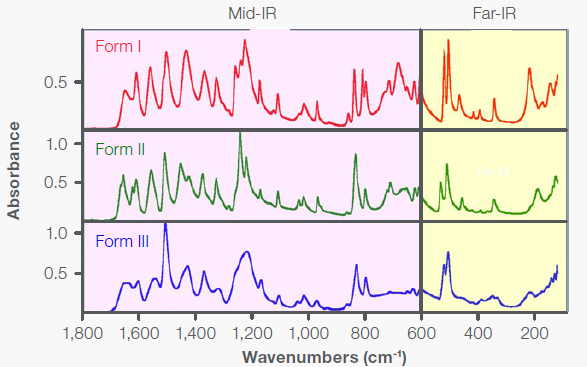
Figure 6. Far-IR diamond ATR spectra of the three polymorphic forms of acetaminophen. Image Credit: Thermo Fisher Scientific - Vibrational Spectroscopy
NIR Transmission (10,000-4000 cm-1)
NIR spectroscopy is based on molecular overtone and combination vibrations. It provides distinct sampling benefits, including the ability to sample directly through glass containers. The transmission spectra of Forms I and II (Figure 7) were obtained as material was melted and cooled on glass microscope slides. The glass does not interfere with NIR measurements. The areas highlighted (6200-5775 cm-1 and 5000-4830 cm-1 ) contain the most distinct differences.
Differentiating the two polymorphs remains possible despite the broader overlapping peaks. Notably, in contrast to mid-IR, NIR transmission measurements accommodate substantially thicker samples thanks to reduced absorption, allowing for increased penetration. The ability to evaluate thicker samples enables more representative sampling and enhances the precision of quantitative measurements.
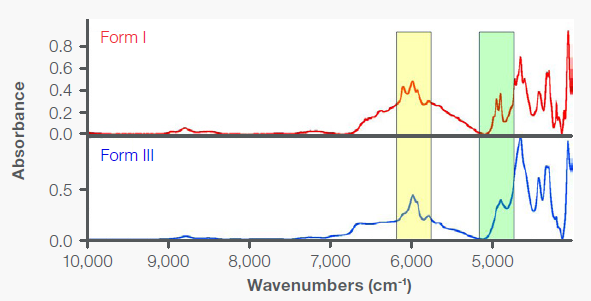
Figure 7. NIR transmission spectra of Forms I and II of acetaminophen on glass slides. Image Credit: Thermo Fisher Scientific - Vibrational Spectroscopy
NIR Reflection (10,000 - 4000 cm-1)
Figure 8 presents NIR reflection spectra obtained using the NIR integrating sphere of an iS50 NIR module. The spectrum of Form I was obtained with the material in a vial. For Forms II and III, the spectra were measured through the back side of the glass microscope slide on which the sample was melted. The tablet was positioned directly on the integrating sphere window.
The spectrum of the commercial acetaminophen tablet verifies the presence of acetaminophen in Form I, as evidenced by the distinct peak patterns in the highlighted regions.
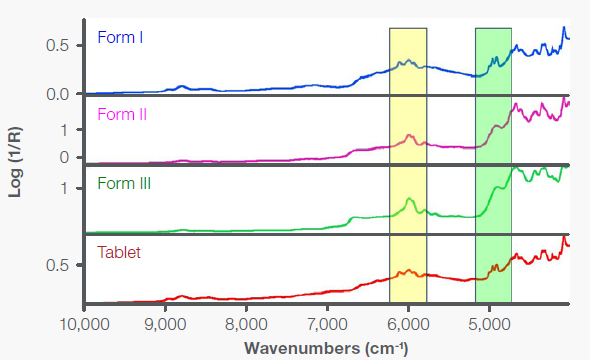
Figure 8. NIR diffuse reflection spectra of Forms I, II, and III of acetaminophen and a commercial acetaminophen tablet. Image Credit: Thermo Fisher Scientific - Vibrational Spectroscopy
Raman (3700-100 cm-1)
Raman is another form of vibrational spectroscopy. Similar to mid-IR, a Raman spectrum typically consists of sharp peaks caused by fundamental molecular vibrations. However, Raman is based on different selection rules than mid-IR and is highly complementary to mid-IR.
Moreover, Raman shares numerous sampling benefits of NIR, including the capacity to sample through glass. It also provides information in the low-frequency region, similar to far-IR. Figure 9 displays Raman spectra of Forms I, II, and III. There are considerable frequency shifts and intensity differences for the peaks from the different polymorphs.
The most indicative peak is the lattice phonon peak at 121.5 cm-1, which is present in the spectrum of Form II but absent in the other two forms. The large shoulder at the edge of the spectrum of Form I arises from a peak at 89 cm-1, which lies just outside the spectral range of the FT-Raman module.4
Form III does not feature either of these peaks but does exhibit a large shoulder that extends down past 50 cm-1. Form III differs substantially from Form I in other parts of the spectrum, making them easily distinguishable.
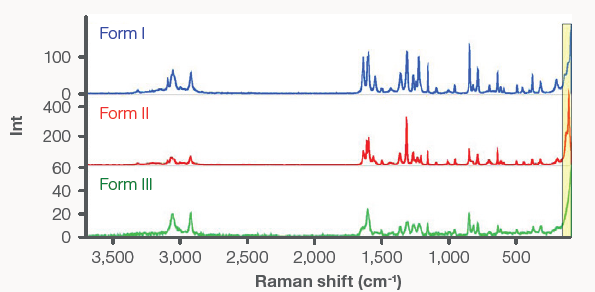
Figure 9. FT-Raman spectra of Forms I, II, and III of acetaminophen. Image Credit: Thermo Fisher Scientific - Vibrational Spectroscopy
An FT-Raman accessory can be utilized to map samples. Figure 10 exhibits a case where five regions on a migraine tablet were mapped. The multivariate curve resolution (MCR) images display the spatial distribution of the two most abundant components in the tablet. The green regions correspond to acetaminophen in Form I, while the blue regions correspond to aspirin.
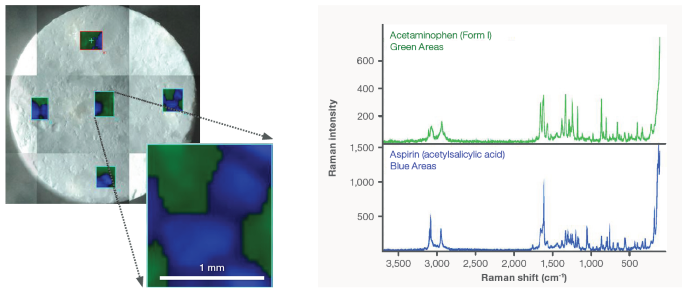
Figure 10. FT-Raman mapping of 5 regions on a commercially available migraine tablet. The MCR images show the distribution of the two largest components (acetaminophen – Form I (green) and aspirin (blue)). Image Credit: Thermo Fisher Scientific - Vibrational Spectroscopy
Conclusions
This article presents the analysis of acetaminophen polymorphs through mid-IR, far-IR, NIR, and Raman utilizing an iS50 FTIR spectrometer. Each spectroscopic technique facilitated the successful differentiation of the three polymorphs.
Different vibrational spectroscopy methods provide complementary data regarding molecular structures, dynamics, and interactions. Integrating various vibrational spectroscopy methods enables scientists to gain a more complete understanding of materials and verify analytical findings.
The Thermo Scientific Nicolet iS50 FTIR Spectrometer supports mid-IR, far-IR, NIR, and Raman spectroscopy within a single platform. It features software-selectable, automatic switching of beamsplitters, detectors, and light sources to match each mode. This system delivers unparalleled adaptability and flexibility, enabling a synergistic approach to uncover deeper insights into the characteristics and behavior of diverse materials and compounds.
Acknowledgments
Produced from materials originally authored by Robert Heinz, PhD, and Rui Chen, PhD, Thermo Fisher Scientific.
References and Further Reading
- Gao, Y. and Olsen, K.W. (2014). Unique Mechanism of Facile Polymorphic Conversion of Acetaminophen in Aqueous Medium. Molecular Pharmaceutics, 11(9), pp.3056–3067. https://doi.org/10.1021/mp500251w.
- Shum-Li Wang, Shan-Yang Lin, Yen-Shan Wei, Chem. Pharm. Bull. 2002, 50(2)153-156
- Suresh, K., Ashe, J.S. and Matzger, A.J. (2019). Far-Infrared Spectroscopy as a Probe for Polymorph Discrimination. Journal of Pharmaceutical Sciences, (online) 108(5), pp.1915–1920. https://doi.org/10.1016/j.xphs.2018.12.020.
- Arianna Rivalta, Tommaso Salzillo, Elisabeth Venuti, Raffaele G. Della Valle, Barbara Sokolovic, Oliver Werzer, Aldo Brillante, ACS Omega 2018, 3, 9564-9571
This information has been sourced, reviewed and adapted from materials provided by Thermo Fisher Scientific - Vibrational Spectroscopy.
For more information on this source, please visit Thermo Fisher Scientific - Vibrational Spectroscopy.