Sponsored by AvantesReviewed by Maria OsipovaAug 18 2025
Nondestructive technologies based on visible/near infrared (VIS/NIR) spectroscopy are widely used to analyze fruit quality. One example of this is determining the soluble solids content (SSC) of apples (and other fruits).
These spectroscopic techniques have enabled fast, accurate, and non-destructive analysis, appropriate for real-time quality assessment in the fruit sector.
One notable feature of VIS/NIR spectroscopy is its ability to measure fruit integrity without affecting it.
It is important to understand that the performance of data-driven systems is highly influenced by both the amount of input data and the calibration methods used.
This article offers a simple setup to demonstrate the potential of VIS/NIR spectroscopy. It explores using an Avantes AvaSpec-VRS2048CL-EVO spectrometer to obtain rapid and accurate spectral data for assessing internal fruit quality.
To do so, the absorbance of various apple varieties was calculated and plotted throughout the appropriate wavelength range (600 nm to 1100 nm). A regression-based model was then used to calculate the SSC (°Brix) of apples.
This article also shows how VIS/NIR spectroscopy can check fruit quality quickly and nondestructively, using a simple setup to estimate SSC in apples. Avantes spectrometers, which are known for their great sensitivity and rapid data acquisition, improve the efficiency and accuracy of analytical applications in agriculture.
Image Credit: ELENA DMITRIEVA_16/Shutterstock.com
Introduction
From taste to texture, fruit quality plays a key role in consumer satisfaction. Apples, in particular, are judged not just by how they look but also by their sweetness, firmness, and acidity. Apples are one of the world's most popular fruits, noted for their nutritional content and health advantages.1
Evaluating apple quality is an important procedure in the fruit industry. It considers both visual features, such as color, size, and shape, and interior properties, such as firmness, acidity, and soluble solids content (SSC).
This evaluation procedure is critical for maintaining consumer happiness, improving apple manufacturing practices, and making educated sorting decisions.2
Advances in technology have provided the fruit sector with both destructive and nondestructive ways for analyzing critical quality characteristics. Developing nondestructive techniques, particularly visible/near-infrared spectroscopy (VIS/NIR), has been critical in updating fruit quality evaluation procedures.
VIS/NIR spectroscopy is a quick, non-destructive method of testing fruit quality, with various benefits including reduced fruit waste, labor costs, and processing efficiency.3,4
VIS/NIR spectroscopy, which focuses on the visible and near-infrared areas of the electromagnetic spectrum, uses the interaction of light with the fruit to provide extensive insights into surface and internal quality characteristics.
In addition, incorporating advanced chemometric models has enabled exact nondestructive evaluation of internal fruit quality.
Multivariate statistical approaches, such as principal component analysis (PCA) and partial least squares (PLS) regression, are often employed in chemometric models to extract relevant features from raw spectral data.3
These models provide more precise predictions of fruit quality, improving the ability to monitor and control production standards across the supply chain.5
The soluble solids content (SSC) of apples is an important measure of their quality because it is closely related to their sweetness and overall flavor profile. SSC is an important metric of apple maturity, influencing consumer attraction and purchasing decisions.2,3,4
The SSC is usually represented as °Brix, which measures the quantity of sucrose in 100 grams of solution at a certain temperature.2 As the demand for high-quality apples grows, the ability to analyze SSC accurately and efficiently becomes increasingly vital.
Nondestructive techniques such as VIS/NIR spectroscopy and advanced chemometric models provide a viable approach for correctly evaluating SSC and other essential quality parameters without harming the fruit.
Avantes' spectrometers are commonly used in fruit sorting because of their sensitivity and rapidity. This article provides an example of using an Avantes AvaSpec VRS2048CL-EVO spectrometer and chemometric modeling to sort apples based on SSC values.
Materials and Methods
Instrumentation
Spectrometer. Source: Avantes
| Specification |
Description |
| AvaSpec |
AvaSpec-VRS2048CL-EVO, VARIUS™ fiber-optic spectrometer, 75 mm AvaBench, 2048-pixel CMOS detector 14 x 200 μm, USB powered, highspeed USB 2.0 and ETH interface. |
| Grating |
300 Lines/mm with 1 μm Blaze |
| Range |
600 nm – 1100 nm |
| Slit |
100 μm |
Accessories. Source: Avantes
| Type |
Description |
| *ATT-DA |
Direct-attach fiber-optic attenuator, 0-100%, SMA-connector |
| **COL-UV/VIS-25 |
Collimating lens |
* An attenuator was attached to the spectrometer to prevent detector saturation when measuring the bright reference.
** A collimating lens was attached to the optical fiber end in order to maximize light input to the spectrometer when placing apples in front of the light source
Light Source. Source: Avantes
| Type |
Power |
Voltage |
Color temperature |
| Halogen bulb |
50 W |
220 VAC |
2700 K |
Software. Source: Avantes
| Type |
Version number |
| AvaSoft |
8.16.1 |
| AvaSpecX64-DLL |
9.14.0.0 |
| Python |
3.12.5 |
Optical fiber. Source: Avantes
| Type |
Diameter |
Length |
Shielding |
| FC-UVIR600-2-BX |
600 μm |
2 m |
Stainless Steel |
Samples
Source: Avantes
| Apple Type |
Quantity |
| A |
10 |
| B |
10 |
Data Acquisition
At the start of each measurement session, a dark and bright reference were recorded for absorbance (transmittance) calculations.
The dark reference was recorded with the spectrometer's attenuator closed (completely obstructing the light path). In contrast, the bright reference was taken with the attenuator set to let the maximum amount of light into the spectrometer without saturating the detector, with a 1.5 ms integration time.
After that, each apple was placed between the light source and sensor to capture its spectral signature.
Because the apple is an opaque item, the attenuator was fully opened, and the collimating lens was positioned at a -45 ° angle to the axis of the halogen bulb (Figure 1) to maximize the light captured on the opposite side.
Multiple scans were taken of each sample as it moved along a conveyor belt. This was done to account for the most significant variation in the spectral data acquired for use in the chemometric model.
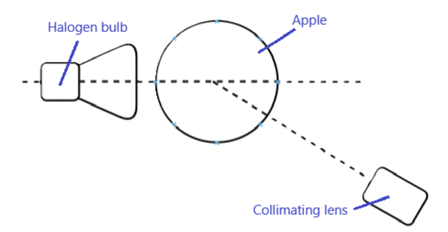
Figure 1. Schematic top view of the measurement setup. Image Credit: Avantes
Acquisition Parameters
Source: Avantes
| Parameter |
Value |
| Integration time |
1,5 ms |
| *Smoothing pixels |
3 |
| **Averaging |
1 |
* This value for smoothing pixels is to be used in combination with a 100 μm slit. For other slit/fiber sizes different values for smoothing pixels may apply.
** Averaging was set to 1 so that the maximum number of scans were captured when apples are put on the conveyor belt at fruit-sorting factories. For such setup, utilizing a trigger cable and an obstacle sensor is necessary.
Pre-Processing
Data pre-processing is crucial in eliminating noise and improving the accuracy of predictions.
The spectrum data collected during the experiments was preprocessed (in Python) using Asymmetric Least Squares (ALS) baseline correction, smoothing with a Savitzky-Golay filter, and normalization to rescale the spectral data between 0 and 1.
Chemometric Model
Chemometric models, particularly those based on PLS regression, have proven useful in the nondestructive prediction of SSC in apples using VIS/NIR spectroscopy.3,6
PLS regression was used to estimate SSC values using absorbance data as an input. The reference SSC values used to train the model were measured with a refractometer. SSC measurements were performed on four out of ten samples of each apple type.
Because refractometry is a destructive approach, the four samples were eliminated from subsequent data acquisition sessions. The data from the remaining six samples were utilized to train the chemometric model.
Reference Values (°Brix)
Source: Avantes
| |
Apple Type A |
Apple Type B |
| Sample #1 |
14,6 °Brix |
11,4 °Brix |
| Sample #2 |
13,4 °Brix |
11,8 °Brix |
| Sample #3 |
14 °Brix |
12,2 °Brix |
| Sample #4 |
13,6 °Brix |
12,4 °Brix |
Results
Spectral Data
Figure 2 shows the absorbance curves of each sample within the intended wavelength range (600 nm-1100 nm) for each apple species. Because many scans were acquired for each sample, each curve represents the mean value, with a darkened region representing the standard deviation of all scans.
Because the spectral data were normalized during preprocessing, absorbance values on the y-axis range between 0 and 1. The mean absorbance spectra for each apple species were calculated using the data presented in Figure 2 and shown within the specified wavelength range in Figure 3.
Figure 3 depicts absorbance curves with maxima at around 675 nm, 760 nm, and 970 nm. In addition, when comparing the mean absorbance spectra of apple type-A and apple type-B, the ratio of the 675 nm peak to the 970 nm peak appears to change.
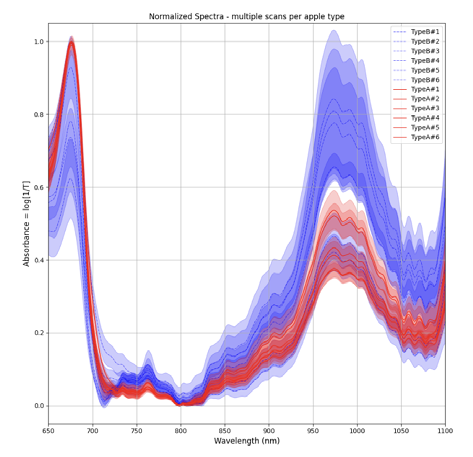
Figure 2. Preprocessed absorbance spectra - multiple scans per sample. Image Credit: Avantes
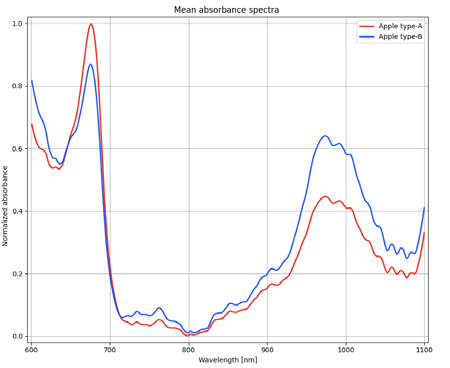
Figure 3. Mean absorbance of spectral data captured per apple type. Image Credit: Avantes
Calculated SSC Values Using PLS Regression
After preprocessing the spectral data (model inputs), it was separated into train and test sets using 5-fold cross-validation. The validation was repeated three times, and the average R2 value was obtained to assess accuracy. Figure 4 shows a plot of the estimated SSC values versus the reference values.
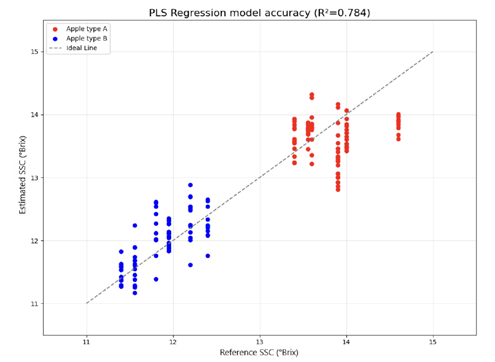
Figure 4. Estimated SSC values plotted versus the reference SSC values. Image Credit: Avantes
Discussion
Figure 3 depicts absorption peaks at 675 nm, 760 nm, and 970 nm. These peaks are important for determining apple quality because they may correspond to chlorophyll, C-H, and O-H absorption bands, which relate to the interior composition, such as minerals and water content.5
Although the absorbance data shows substantial peaks at various wavelengths, the relationship between these features and the internal content is not clear because the data is redundant.
Using data-driven techniques requires feature extraction to minimize data dimensionality, resulting in a more robust predictive model that is less sensitive to unrelated fluctuations in absorbance spectra. The PLS regression model's performance was tested by calculating R2 scores (average of 0.784).
As fruit orientation during spectrum collection, spectral data preprocessing, and the number of samples required to train the model all have a significant impact on performance, optimizing these parameters ensures enhanced model accuracy.1,5
As a data-driven approach, Chemometric modeling necessitates a big dataset to adequately represent variability in elements such as sample shape, SSC, and positioning relative to the light source.
As a result, future increases in the number of samples can improve the model's accuracy. Temperature compensation strategies can also improve the model's responsiveness to changing conditions.5
Beyond sample quantity and temperature, factors such as fruit orientation during spectral measurement and appropriate wavelength selection are important in guaranteeing accurate SSC predictions. For example, specific orientations and taking more averages can improve the signal-to-noise ratio of acquired spectra.
To improve the accuracy and robustness of internal quality assessments in fruits, localized calibration procedures are advised. These methods tailor the calibration subset to the individual properties of the sample, boosting robustness through increased sample homogeneity.4
In addition, variable selection strategies, such as competitive adaptive reweighted sampling (CARS) and successive projections algorithm (SPA), are required to refine PLS models.7 Finally, improved data processing techniques such as machine learning will produce faster and more accurate outcomes.2
Conclusion
This simplified setup shows how VIS/NIR spectroscopy can quickly and accurately assess fruit quality, without damaging the produce. With tools like the Avantes spectrometer, growers can make better decisions and reduce waste across the supply chain.
References
- Tian, X., et al. (2020). An optimal zone combination model for on-line nondestructive prediction of soluble solids content of apple based on full-transmittance spectroscopy. Biosystems Engineering, 197, pp.64–75. https://doi.org/10.1016/j.biosystemseng.2020.06.010.
- Justyna Grabska, et al. (2023). Analyzing the Quality Parameters of Apples by Spectroscopy from Vis/NIR to NIR Region: A Comprehensive Review. Foods, 12(10), pp.1946–1946. https://doi.org/10.3390/foods12101946.
- Fan, S., et al. (2019). Long-term evaluation of soluble solids content of apples with biological variability by using near-infrared spectroscopy and calibration transfer method. Postharvest Biology and Technology, 151, pp.79–87. https://doi.org/10.1016/j.postharvbio.2019.02.001.
- Luo, X., et al. (2018). Robustness improvement of NIR-based determination of soluble solids in apple fruit by local calibration. Postharvest Biology and Technology, 139, pp.82–90. https://doi.org/10.1016/j.postharvbio.2018.01.019.
- Guo, Z., et al. (2020). Nondestructive monitoring storage quality of apples at different temperatures by near-infrared transmittance spectroscopy. Food Science & Nutrition, (online) 8(7), pp.3793–3805. https://doi.org/10.1002/fsn3.1669.
- Fan, S., et al. (2015). Using Vis/NIR Diffuse Transmittance Spectroscopy and Multivariate Analysis to Predicate Soluble Solids Content of Apple. Food Analytical Methods, 9(5), pp.1333–1343. https://doi.org/10.1007/s12161-015-0313-5.
- Jaywant, S.A., Singh, H. and Arif, K.M. (2022). Sensors and instruments for brix measurement: A review. Sensors, 22(6), p.2290. https://doi.org/10.3390/s22062290.

This information has been sourced, reviewed and adapted from materials provided by Avantes.
For more information on this source, please visit Avantes.