Scanning Transmission Electron Microscopy (STEM) is one of the foremost imaging and analytical techniques, able to offer both the high spatial resolution of transmission electron microscopy and the precision of a focused electron probe.
STEM works by rastering a highly focused electron beam across a surface. This beam is often smaller than a single atom and uses multiple detectors to collect signals from transmitted and scattered electrons and characteristic X-rays.
STEM can provide data on the elemental, structural, and compositional information of a surface at sub-nanometer resolution, allowing individual atomic columns to be imaged and detailed elemental maps to be generated.
These capabilities have led to STEM becoming widely regarded as a cornerstone of semiconductor research, nanotechnology, and materials science.
However, despite its many advantages, STEM has inherent limitations. For example, the intense electron beam has the potential to damage biological or soft materials or other sensitive samples, potentially altering surface topography and limiting subsequent analyses. It is also important to note that STEM provides elemental as opposed to molecular information, limiting its capacity to comprehensively characterize a sample’s chemical composition.
The Photo-Induced Force Microscopy (PiFM) from Molecular Vista complements STEM, offering a combination of non-destructive chemical analysis and nanoscale resolution. PiFM uses a precisely tuned infrared (IR) laser to excite molecular vibrations in a specified region of the sample surface, while a sensitive atomic force microscope (AFM) probe measures the resulting photo-induced force and its standard topography data.
Using the second mechanical resonance and operating in non-contact mode, PiFM eliminates tip-sample contact, preserving sample integrity for STEM or other follow-up analyses. The tip-enhanced field generated by the IR laser also allows users to perform high-precision chemical characterization, typically offering higher spatial resolution versus the topographical image.
Researchers can obtain a more complete understanding of sample structure, composition, and chemistry by employing this powerful combination of STEM and PiFM. STEM’s unparalleled structural and elemental imaging coupled with PiFM’s molecular insight offers users a platform for comprehensive nanoscale analysis.
Identifying the same region of measurement can be difficult for effective nanoscale correlative studies across different instruments. Using a TEM grid when working with STEM and PiFM can help to provide the natural fiducial features required to confidently navigate to the same locations.
Application 1: Chitin Nanocrystals
Chitin nanocrystals form twisted aggregates that are approximately one micrometer in length. These aggregates can be mounted on TEM grids for analysis using STEM.
The second to the left image in Figure 1 shows a STEM image of a square in a TEM grid. The dotted blue square has been zoomed in to produce the upper image, third from the left. The blue square in the upper image has been zoomed in a second time to produce the lower image, third from the left, which features the target chitin aggregate identified from a number of chitin nanocrystals.
When the same sample is placed in Molecular Vista’s PiFM system, it is possible to identify the same TEM grid via the integrated optical microscope (the AFM cantilever is visible in the optical view), in the far left image on Figure 1. The visible aggregates on the TEM grid (far left) correspond to the aggregates in the STEM image (second from the left).
When the topography image is collected from the PiFM instrument (far right), the features in the zoomed-in STEM image can be matched, illustrated by blue arrows pointing at the same features.
Associating visible features with a TEM grid allows the two instruments to analyze the same sample location using STEM and PiFM.
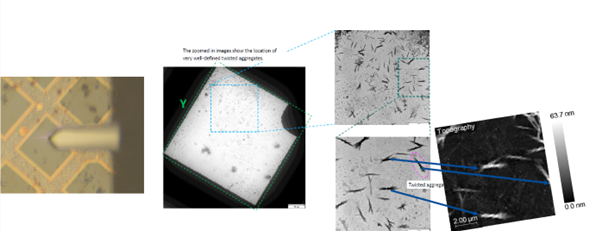
Figure 1. STEM images of chitin nanocrystals (second from left, third from left both top and bottom). Optical image of the same sample with visible AFM cantilever on far left, AFM topography far right. Same features between the STEM and AFM topography are shown with arrows. Image Credit: Molecular Vista
STEM offers exceptional structural and topographical resolution, but it has a notable limitation: it cannot provide molecular information. It is impossible to determine the chemical composition of the observed aggregates from the STEM image alone, or to detect potential surface contaminants.
The sample shown above could theoretically have other samples of a similar shape present that are not chitin nanocrystals. PiFM addresses this key limitation by offering complementary molecular-level insight.
Figure 2 features the standard AFM topography of the targeted chitin nanocrystal. Four PiF-IR spectra were acquired from different regions of interest in this example, with each highlighted with colored markers. Figure 3 shows the PiF-IR spectra associated with those regions, with each revealing local chemical information.
This combined approach offers a more complete understanding of the sample by allowing researchers to correlate structural features with chemical composition.
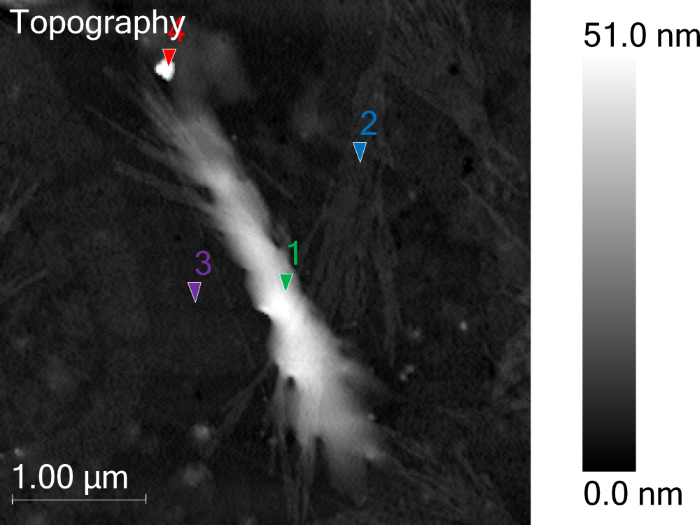
Figure 2. AFM Topography from the target chitin nanocrystal. Note the colored triangles, where point PiF-IR spectra are acquired on. Image Credit: Molecular Vista
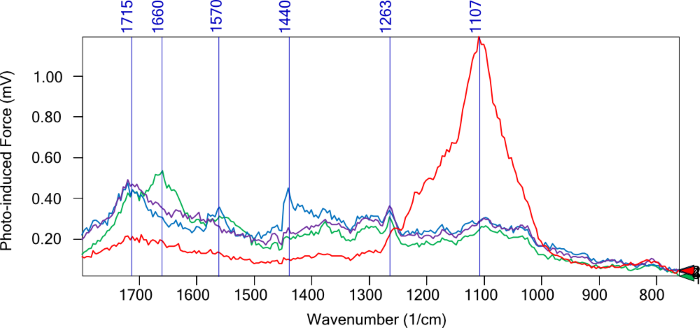
Figure 3. Point PiF-IR spectra acquired from colored triangles indicated in Figure 2. Image Credit: Molecular Vista
PiF-IR spectra show discrete chemical signatures across several regions of the sample. The thick chitin area (green spectrum) revealed a prominent amide I peak at 1660 cm−1 with a shoulder at ~1630 cm−1 and a weaker amide II peak at ~1560 cm−1. The latter of which was suggestive of α-chitin.
The thinner, fiber-like structures (blue spectrum) show peaks at 1715 cm−1, 1570 cm−1, and 1440 cm−1, confidently distinguishing these regions from the main chitin aggregate.
It was also noted that relatively clean regions (purple spectrum) of the substrate displayed a 1715 cm−1 peak with an intensity increase close to 1263 cm−1, signifying contributions from the substrate itself.
The red spectrum featured a strong peak at 1107 cm−1, most likely corresponding to a contaminant. This spatially resolved molecular data is not accessible via STEM alone, with this example highlighting the chemical heterogeneity between chitin, the substrate, fibers, and localized contaminant.
PiFM images at specific IR wavelengths can be acquired to generate chemical maps to further enhance visualization (Figure 4). The images at 1660 cm−1, 1440 cm−1, 1263 cm−1, and 1107 cm−1 highlight the α-chitin, unknown fibrous molecules, substrate, and contaminants, respectively.
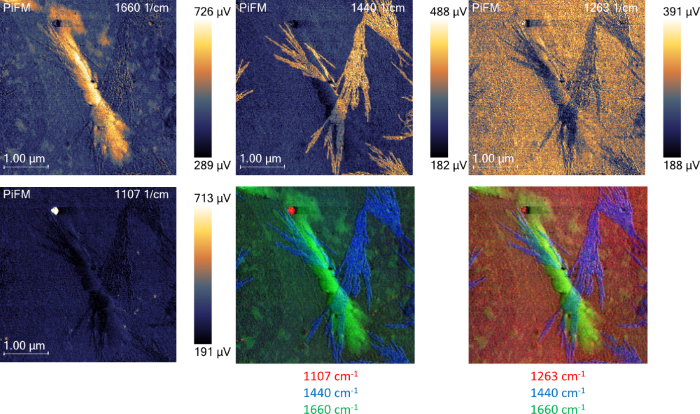
Figure 4. PiFM images at different wavenumbers highlight different components of the sample. The two bottom right images are a composite of three PiFM images at three different wavenumbers, colored red, green, and blue. Image Credit: Molecular Vista
Application 2: TEM Grid Alignment of Recrystallized Ascorbic Acid Samples
Correlative imaging was performed using a recrystallized ascorbic acid sample mounted on a TEM grid. The far left of Figure 5 shows the TEM grid on which the ascorbic acid samples were deposited, while the second image to the left of Figure 5 is a STEM image illustrating the different grids within the TEM sample holder.
The green square around the a single sample in the TEM grid in the second image from the left has been magnified to produce the image third from the left. This same grid was identified via the integrated optical microscope (far left image) in the PiFM instrument.
A large AFM scan was performed in the area surrounded by the purple border in the third from the left image. The image acquired from the scan is the far left, lower image. The topography features from the AFM image and SEM image can be matched, as bright features in STEM appear lower in AFM topography, which is darker.
It was then possible to zoom in further to the red square from the AFM scan to produce the topography image on the top right. Multiple PiF-IR point spectra were acquired at selected locations designated by the colored triangles. The corresponding spectra are shown in Figure 6.
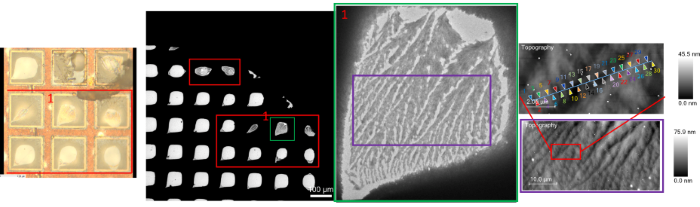
Figure 5. STEM image of recrystallized ascorbic acid sample on the second and third from left. Topography images acquired on the far right, both top and bottom, using the PiFM instrument. Top far right has colored triangles indicating where point PiF-IR spectra were acquired from. The far left is an optical view of the sample seen with the integrated optical microscope in the PiFM instrument. Image Credit: Molecular Vista
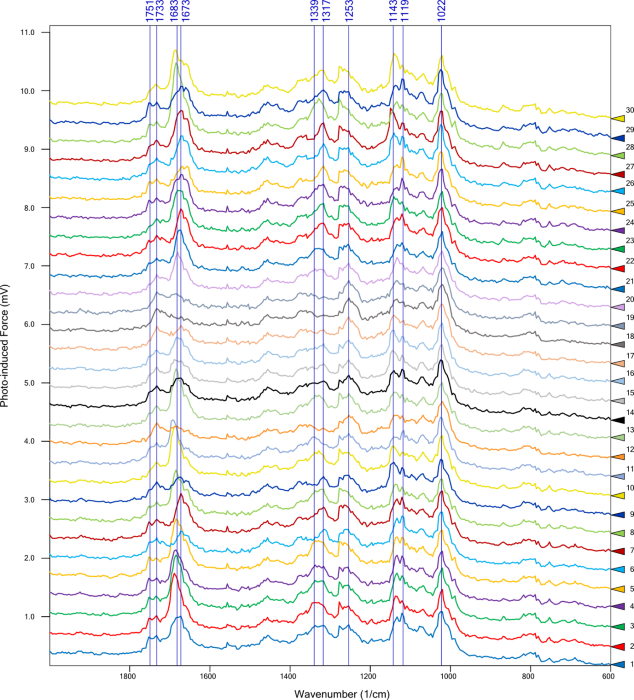
Figure 6. PiF-IR spectra obtained from colored triangle locations in the upper right image of Figure 5. Image Credit: Molecular Vista
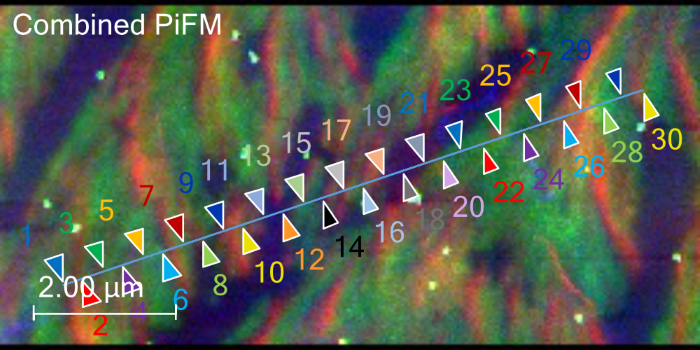
Figure 7. Combined PiFM image, coloring in the 1733 (blue), 1670 (green), and 1144 (red) cm−1 areas. Image Credit: Molecular Vista
Point spectra highlighted wavenumbers of interest at 1733 cm−1, 1670 cm−1, and 1144 cm−1, with PiFM images at those wavenumbers highlighted in blue, green, and red, respectively. These were then combined to produce a chemical map (Figure 7).
This combined PiFM image reveals that ascorbic acid crystals are primarily highlighted in two distinct colors (red and green) while lower-lying regions are highlighted in blue and purple.
Green-highlighted regions show peaks at 1751 cm−1, 1733 cm−1, 1683 cm−1, 1673 cm−1, 1339 cm−1, 1317 cm−1, 1252 cm−1, 1143 cm−1, 1119 cm−1, and 1022 cm−1. Red-highlighted regions feature a notably stronger peak near 1143 cm−1 versus the green regions, while blue and purple regions feature reduced intensity around 1683 cm−1 to 1673 cm−1, with a marginally enhanced response around 1733 cm−1.
These differences in spectral features reflect variations in molecular orientation present within the ascorbic acid crystals. Molecular Vista’s customer is continuing to investigate how PiF-IR peaks are linked to different molecular orientations. But these preliminary results already showcase the power of correlative PiFM and STEM for analyzing recrystallized ascorbic acid samples.
Precisely aligning the same sample region across both techniques allows the direct linking of high-resolution structural information obtained via STEM with molecular orientation data acquired via PiFM.
Important Considerations
The examples presented here show how using STEM initially identifies regions of interest based on distinctive features across different grids. It is possible to perform similar complementary measurements when reviewing defects found on blank silicon wafers, using coordinates provided via a defect inspection tool to navigate to the same defects.
Correlated studies have been conducted on many analyzed defects by reviewing SEMs and PiFM, whereby PiFM measurements were acquired both before and after the SEM analysis.
In many cases it was observed that SEM interactions altered the defects’ topography and chemical composition, most notably for features smaller than 20 nm in height and lateral extent. Therefore, PiFM should first be performed in correlative workflows involving STEM, SEM, or other electron-based (and other destructive) techniques.
Conclusion
The integration of STEM and PiFM combines high-resolution structural and elemental imaging with molecular-level chemical insight to enable comprehensive nanoscale characterization.
Correlative workflows facilitate the precise alignment of the same sample regions, allowing structural features to be linked with molecular orientation and chemical composition. The native state of sensitive samples is preserved by performing PiFM prior to STEM, providing a complementary and reliable framework for detailed nanoscale studies.
Acknowledgments
Produced from materials originally authored by Molecular Vista.

This information has been sourced, reviewed, and adapted from materials provided by Molecular Vista.
For more information on this source, please visit Molecular Vista.