Overview
Key Concepts of the Acid Dissociation Constant
The acid dissociation constant, Ka, and its negative decadic log, pKa, are key life sciences parameters that describe molecular acidity. Specifically, these values indicate the protonation state of a molecule in aqueous solution at a defined pH.
Determining the dissociation constant is essential in disciplines such as biology, medicine, and pharmaceuticals, as it influences the chemical, physical, and biological characteristics of a molecule. The pKa is commonly calculated via potentiometric titration; UV-Vis spectrophotometry also provides an effective method for achieving precise pKa values with less reagents and sample consumption.
In this technique, the UV-Vis spectra of a substance of interest are measured and compared at various pH levels. The pKa of a substance can be determined using the absorbances and the corresponding pH levels.
Automation of the pKa Calculation
A Titrator Excellence T9, a UV5 Spectrophotometer, and an InMotion Pro Autosampler were used. Sample preparation was carried out using various burettes and a DispenSix Liquid Handling system. The automated method developed for pKa calculation integrates two titration techniques for managing samples and measuring pH, respectively, together with a UV-Vis method for the UV-Vis measurement and pKa determination.
A report template was also created using LabX software to summarize the results into a single report. Using the automated procedure, the pKa values were calculated automatically:1
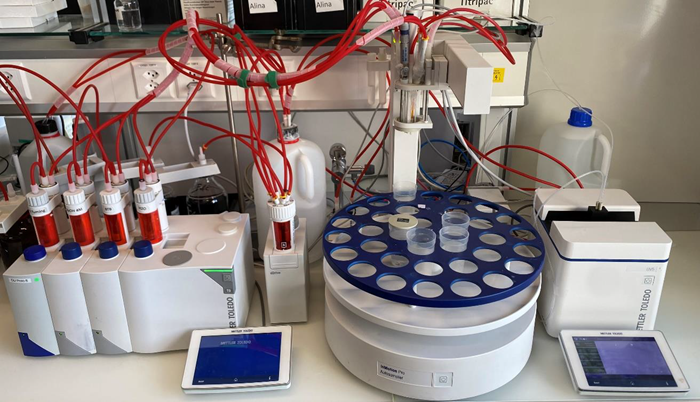
Figure 1. An analytical system for the automated determination of the pKa value by coupling different instruments. The whole system is controlled by the LabX laboratory software1. Image Credit: Mettler-Toledo - Titration
Results of Representative Model Compounds
For bromothymol blue (BTB), a pKa value of 7.20 ±0.03 (25 °C, cion = 0.03-0.14 mol/L) was calculated, while pKa = 5.09 ±0.06 (25 °C, cion = 0.001-0.122 mol/L) for methyl red (MR).
Four Key Concepts
The Degree of Dissociation of An Acid Defines Its Strength
Acids are proton donors, while bases are proton acceptors.2 Two molecules, differing by a single proton, are defined as a conjugated acid-base pair. The equilibrium constant of the reaction serves as a parameter to describe the strength of an acid or base. For instance, the acid HA dissociates in water as shown in Equation 1:
 |
(1) |
The equilibrium constant for this reaction, referred to as the acid dissociation constant, Ka, is expressed in Equation 2. In pure water and diluted solutions, the water molecule concentration is constant and amounts to 55.51 mol/L (25 °C). The water concentration is constant, so it can be incorporated into the acid dissociation constant:
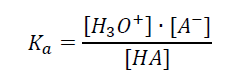 |
(2) |
Ions interact with one another due to their electrical charges.3 A higher ion concentration in the solution leads to a stronger reaction. The attractive forces between ions of opposite charges reduce the number of dissociated molecules in the solution. This apparent reduction is accounted for in the activity a, defined as the product of the concentration with an activity coefficient f of the dissolved substance:
 |
(3) |
When the activity coefficient is closer to one, the activity and concentration coincide better. This is frequently the case when the solution is highly diluted, i.e., for concentrations under 0.1 mol/L. In this guide, concentration and activity are considered equivalent.
For convenience, the acid dissociation constant is usually expressed as the negative decadic logarithm of Ka, known as the pKa, as illustrated in Equation 4.
 |
(4) |
The pKa value indicates acid strength. A smaller pKa value corresponds to a stronger acid, while a larger pKa value corresponds to a weaker acid. The pH value of an aqueous solution is defined as the negative decadic logarithm of the H3O+ activity or concentration, as shown in Equation 5.
 |
(5) |
Equation 6 depicts the Henderson-Hasselbalch equation, which is obtained by combining the negative decadic logarithm of Equation 2 with Equation 5.
 |
(6) |
As a result, the pKa value can be calculated when both the pH value and the concentrations of the acidic HA and basic A-, forms of an acid HA are known.
UV-Vis Absorption Spectra of Color Indicators Vary with pH Values
Bromothymol blue (BTB) is a commonly used acid-base indicator.4 When employed as a model substance for spectrophotometric pKa calculation, BTB produces differently colored solutions at various pH values:

Figure 2. Bromothymol blue (BTB) solutions with different pH values. From left to right: acidic to basic pH values, i.e., from pH 1 up to 13. Image Credit: Mettler-Toledo - Titration
The corresponding absorption spectra of the solutions at different pH levels are shown below:

Figure 3. UV-Vis spectra of aqueous solutions of BTB at different pH values. Image Credit: Mettler-Toledo - Titration
BTB is an effective indicator for visualizing changes in a solution between acidic (yellow, HIn-), neutral (green), and alkaline (blue, In2-) states5. The color variation results from two stems of only two species, a yellow and a blue, while the green form is a mixture of yellow and blue. The two forms are illustrated below:
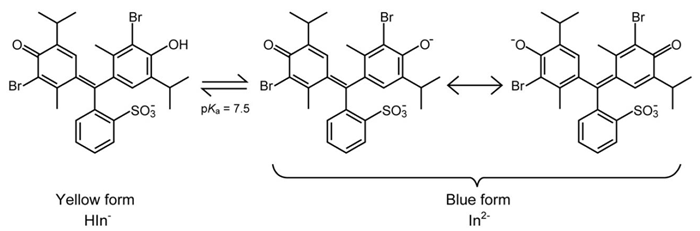
Figure 4. Acidic (yellow) and basic (blue) forms of BTB, dependent on the pH of the solution. Image Credit: Mettler-Toledo - Titration
Dissociation Constant Determined at pH = pKa
To calculate the pKa value of dissolved substances, various solutions of the sample are prepared using pH buffers to achieve a specific pH value. The Henderson-Hasselbalch equation (Equation 6) can be defined for each pH value. For BTB, a color indicator, Equation 6 can be expressed as:
 |
(7) |
Determining the pKa value requires identifying the pH where pH=pKa, i.e., when [In2–]=[HIn–], and therefore log(1) = 0. This is determined by choosing two wavelengths in the UV-Vis spectrum of BTB, where maximum and minimum absorbances are measured in acidic and alkaline media, respectively:
- Wavelength λ1: HIn- strongly absorbs, while the deprotonated form In2- absorbs minimally
- Wavelength λ2: In2- strongly absorbs, while the form HIn- absorbs minimally
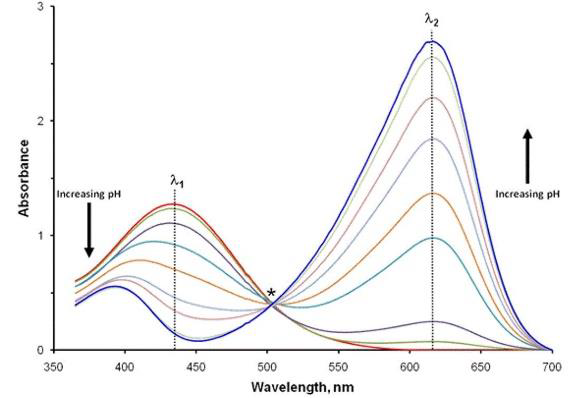
Figure 5. UV-Vis spectra of BTB: With increasing pH, the absorbance at wavelength λ1 decreases, whereas it increases at λ2. Image Credit: Mettler-Toledo - Titration
Absorbance must be corrected at both wavelengths for the minor absorbance contribution from the other species. At wavelength λ1, the maximum absorbance of the acidic species is corrected by subtracting the minimum absorbance of the sample at the highest pH value for each sample.
The same is done at wavelength λ2, where the minimum absorbance with the lowest pH value is deducted from each sample. Finally, the pKa value is obtained from the intercept of the line with the pH-axis as shown in Equation 7, i.e., where log [In2-]/[HIn-] = 06.

Figure 6. Calculation of the pKa value of BTB by linear regression: This is given by the intercept with the pH-axis, i.e., where pKa = pH. Image Credit: Mettler-Toledo - Titration
Fully Automated pKa Calculation Using LabX Laboratory Software
Full automation of the entire process, including detailed documentation, represents a major criterion in the optimization of analytical workflows.
This application established a single analytical system for fully automated pKa calculation by integrating the Titration Excellence T9, DispenSix Liquid Handler, InMotion Autosampler, and UV-VIS Excellence Spectrophotometer UV5.
In summary, the compound of interest, e.g., an API (Active Pharmaceutical Ingredient), is dissolved in deionized water. Multiple solutions at predefined pH values are prepared through automated addition of pH buffers, concentrated acids, and bases in various ratios. Each solution’s UV-Vis spectrum is subsequently recorded.
For example, using Bromothymol blue (BTB) as a model substance for spectrophotometric pKa calculation involves obtaining and measuring various colored solutions at different pH values. The pKa value is subsequently derived from the different spectra measured at varying pH values via LabX software.
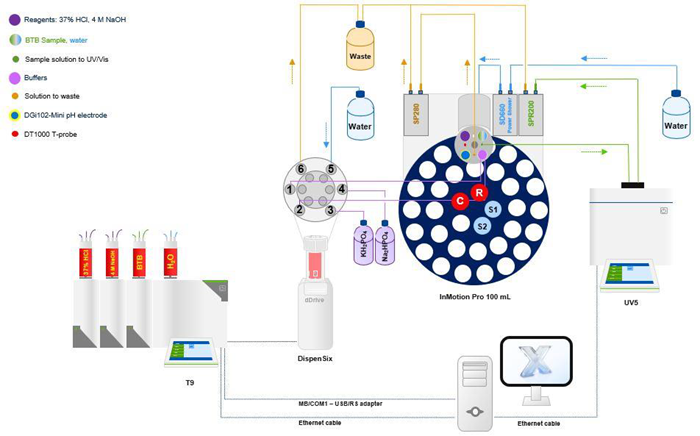
Figure 7. An analytical system for the fully automated determination of the pKa value by coupling different instruments. The whole system is controlled by the LabX laboratory software. Image Credit: Mettler-Toledo - Titration
Detailed calculations are outlined in the section “Calculation of the pKa value” of this document. The complete results have been published in METTLER TOLEDO Titration Application Note M8987.
Specifically, the Advanced Report Editor in LabX Software automatically performs the linear regression of the measured values presented in Figure 8. The pKa value is determined from the intercept of the regression line with the y-axis. All results are then outlined in a detailed report.
References and Further Reading:
- The description of the measurements, as well as the comprehensive and detailed presentation of all the instrument methods have been given in METTLER TOLEDO Titration Application Note M898. This Application Note is available and can be downloaded from www.mt.com : “Determination of The Acid Dissociation Constant by Automated Titration-UV/Vis Workflow”, METTLER TOLEDO Titration Application Note M898, 2023, Acid Dissociation Constant by Automated Titration-UV Vis Workflow (mt.com)
- M. Binnewies et al., „Allgemeine und Anorganische Chemie“, Springer, Berlin, Heidelberg, 2016, pp. 250–266.
- C. E. Mortimer, U. Müller, „Chemie - Das Basiswissen Der Chemie“, Georg Thieme Verlag, Stuttgart, 2007, pp. 293–317.
- Shimada, T. and Hasegawa, T. (2017). Determination of equilibrium structures of bromothymol blue revealed by using quantum chemistry with an aid of multivariate analysis of electronic absorption spectra. Spectrochimica Acta Part A: Molecular and Biomolecular Spectroscopy, (online) 185(1386-1425), pp.104–110. https://doi.org/10.1016/j.saa.2017.05.040.
- G. D. Christian, P. K. Dasgupta, K. A. Schug, Analytical Chemistry, John Wiley & Sons Inc., 2014, pp. 288–290.
- R. D. Braun, “Introduction to Chemical Analysis”, McGraw-Hill Book Company, 1982, pp. 197-202.

This information has been sourced, reviewed, and adapted from materials provided by Mettler-Toledo - Titration.
For more information on this source, please visit Mettler-Toledo - Titration.