AZoMaterials speaks with Bruker about the analytical challenges shaping microplastics research, a rapidly evolving field where reliable, particle-level data is critical. Moving beyond simple polymer identification, researchers must also preserve detailed information about particle size, shape, and distribution to accurately assess environmental and biological impacts.
In this interview, Bruker discusses how advanced infrared and Raman microscopy, combined with automation and AI-driven analysis, is enabling scientists to generate more accurate, scalable insights. These technologies are not only improving data quality but also helping move microplastics analysis toward standardized, routine workflows that support consistent and comparable results.
Bruker has been a long-time ally of microplastics researchers worldwide. Could you outline the main analytical challenges in this field and explain where exactly Bruker supports researchers around the world?
Bruker has been part of the microplastics conversation from the very beginning, when this issue first started gaining real attention in the scientific community. And what’s important to understand is that the analytical challenge doesn’t start with spectroscopy or data collection. It actually starts much earlier.
Before you ever get to measurement, researchers have to collect representative samples, prevent contamination, separate particles from complex matrices, and prepare everything in a way that preserves the particles’ physical integrity. Only after all of that careful work does the actual analysis begin.
At that point, you’re essentially choosing between two different paths: a mass-driven approach or a particle-focused one.
If you take the mass-driven route (like Py-GC/MS) you get a very clear answer on which polymers are present and in what quantities. That’s a real strength. But there’s a trade-off. The particle is destroyed during the process. Once it’s analyzed, it’s gone. You can’t measure it again, and that’s a meaningful limitation.
Particle-driven techniques such as infrared (IR) and Raman microscopy work differently. They’re non-destructive, which means the sample remains intact. You can store it, archive it, and even apply additional spectroscopic methods later for cross-validation. That gives you a much more complete chemical picture.
Just as importantly, these methods let you characterize each individual particle - its size, its shape, its composition. Those physical parameters are critical when you’re trying to understand biological or environmental impact. If you lose that information during analysis, you lose the context that makes the data meaningful in the first place.
That’s why Bruker focuses on particle-driven, spatially resolved analysis. The goal is to reflect real particle populations and answer the questions that actually matter: How much is there? How big are the particles? And how are they distributed?
Could you walk us through a typical microplastics analysis workflow?
A typical microplastics analysis workflow really starts with sample preparation, which is to be honest, the decisive step. Its complexity can vary significantly depending on where the particles come from, whether it's water, soil, food, or biological material. The main objective is always to isolate the particles, preserve their physical integrity, and avoid any contamination along the way.
Once the sample has been processed, the particles are usually collected on a filter. And this is more important than it might seem. Not every filter is compatible with every analytical method, so the choice already influences which spectroscopic approach you can use. In other words, selecting the right filter is a key part of the overall analytical strategy.
After the particles are immobilized on a suitable filter, microscopy-based spectroscopy becomes the central analytical step. Depending on the scientific question, microplastics are typically analyzed using either infrared (IR) microscopy or Raman microscopy, two complementary techniques, each with its own strengths and trade-offs. Choosing between them is itself a strategic decision, and one that deserves a closer look.
Regardless of the chosen method, the underlying principle remains the same: microplastics are treated as individual particles. Spatially resolved spectroscopy provides chemical identification together with size and shape information, allowing researchers to characterize real particle populations. After the spectroscopic data has been acquired, automated and AI-driven software creates extensive particle statistics and reports.
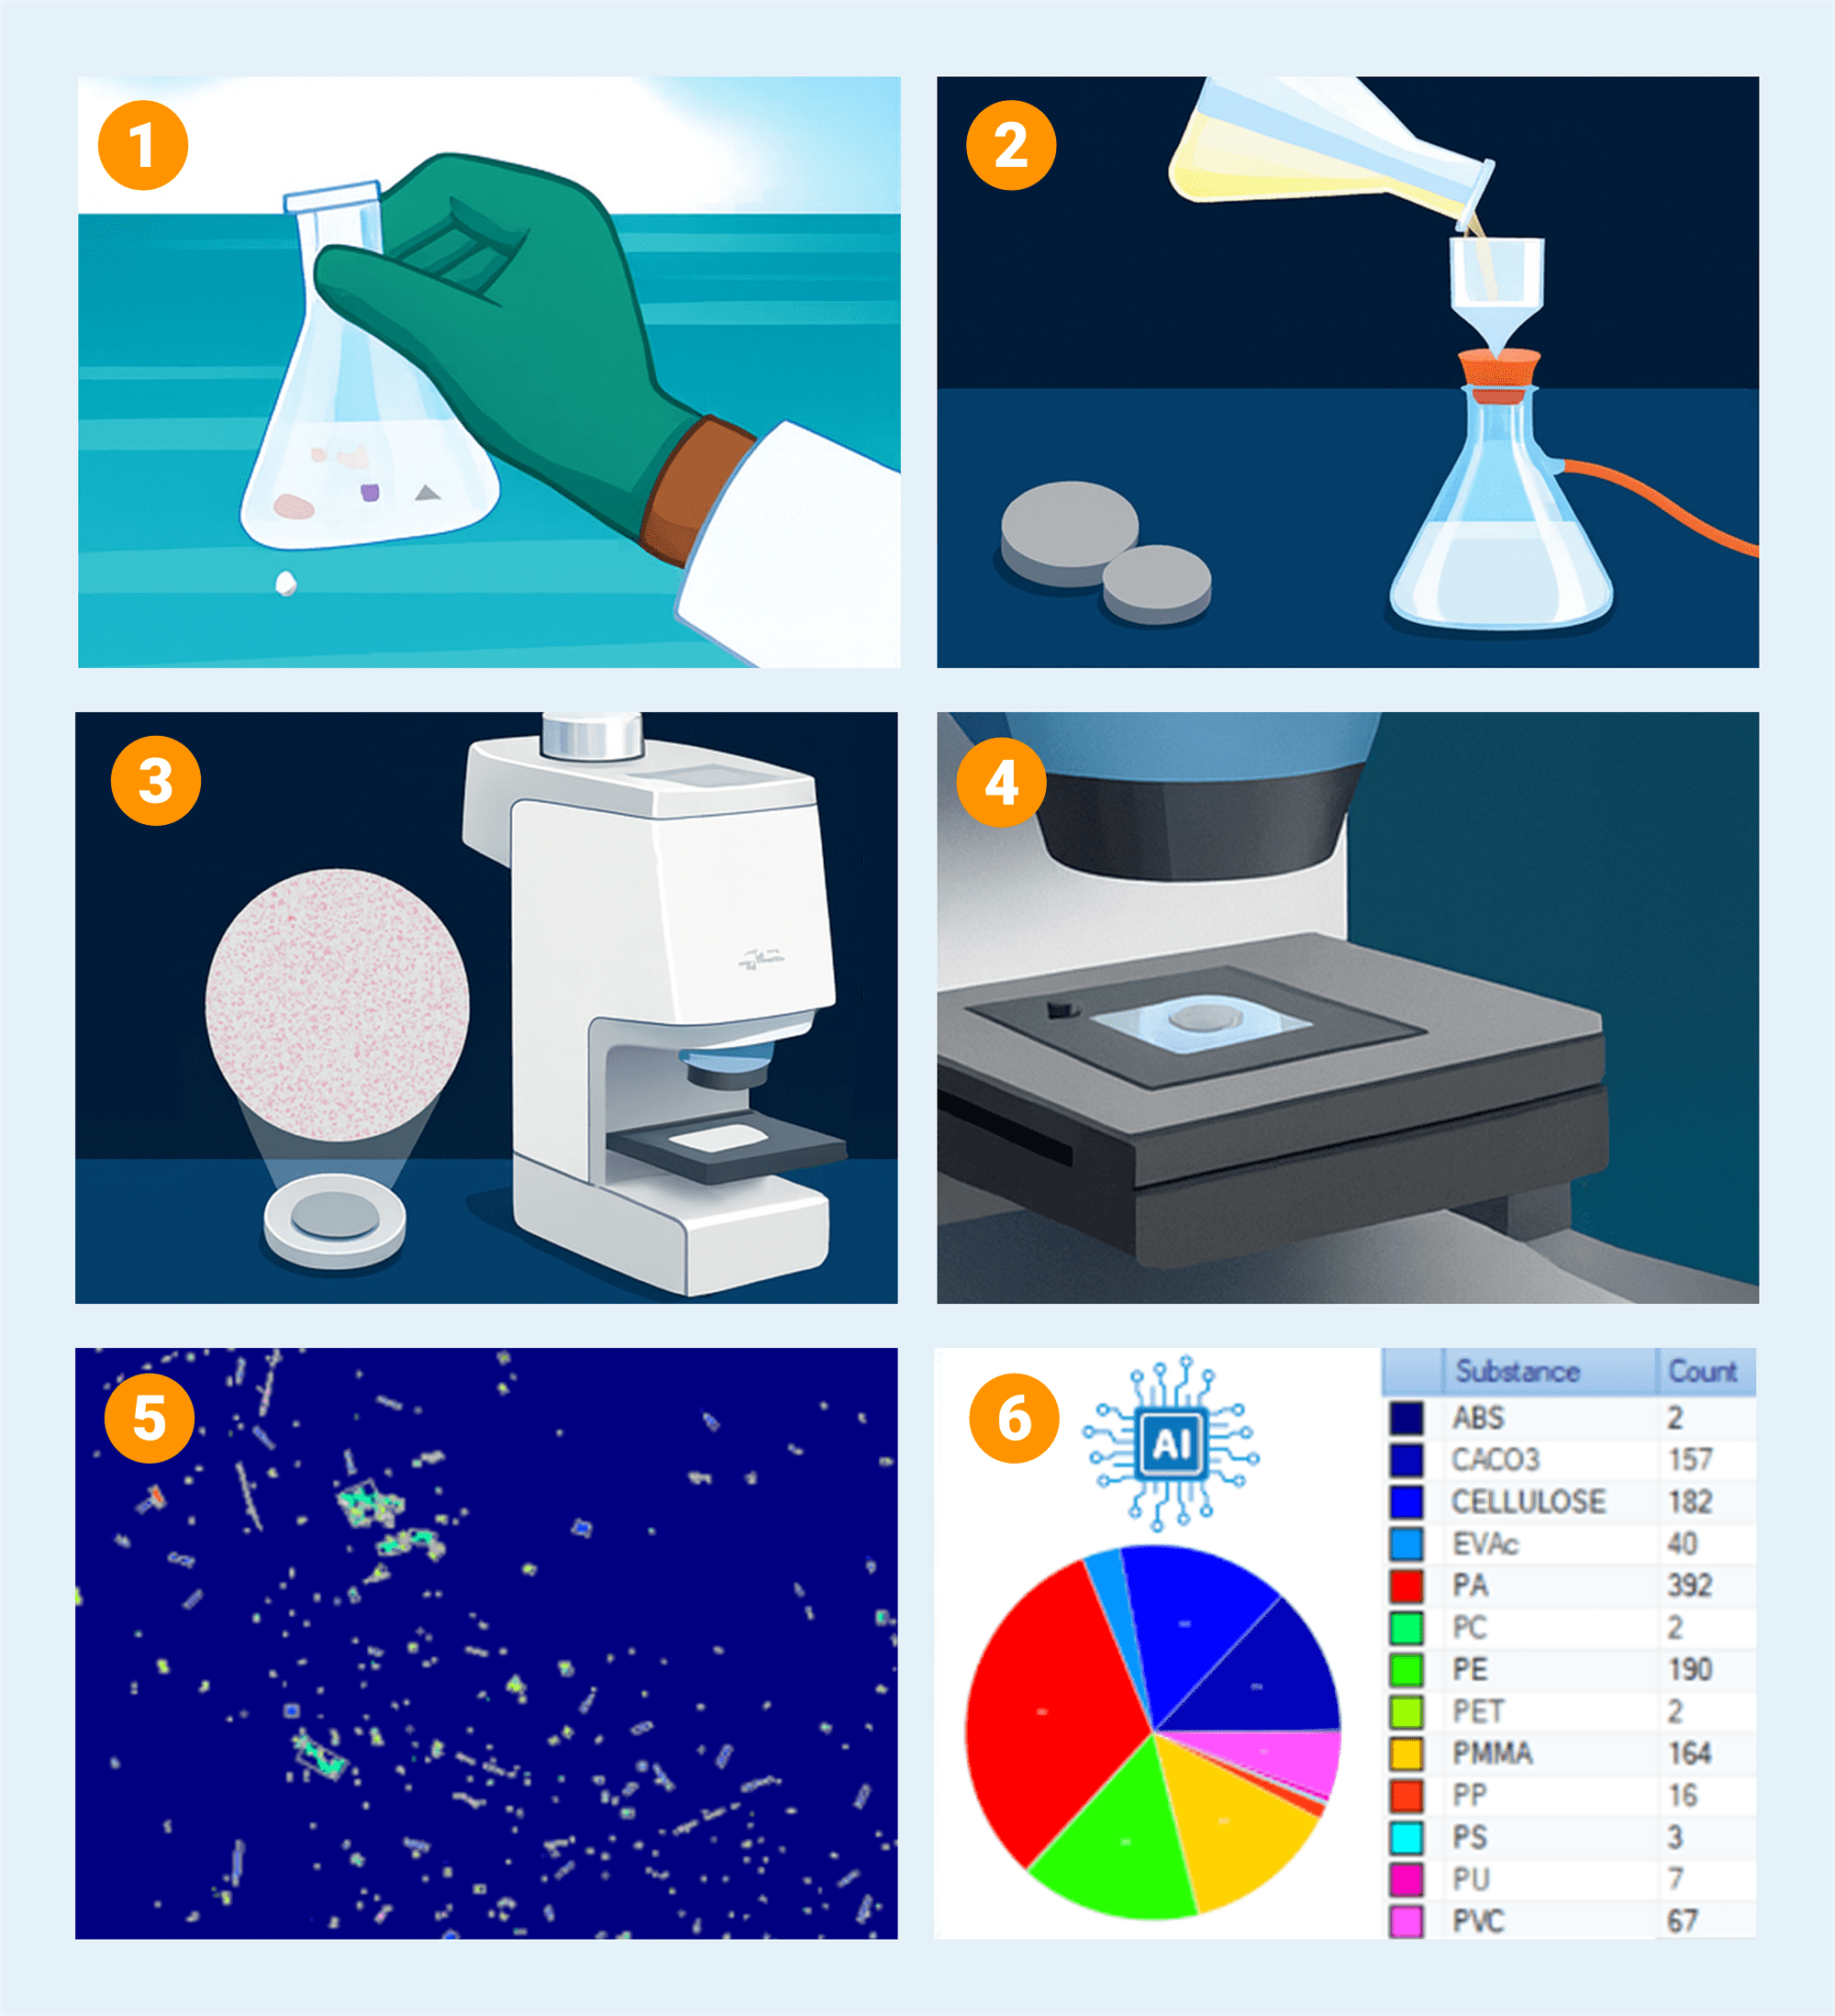
After sample collection (1), the sample preparation (2) is critical to successful microplastics analysis. The remaining steps are straightforward: transfer the sample to the IR or Raman microscope (3), place the filter (4), acquire raw data (5), and derive information on particle size, identity and statistics using autonomous AI-powered tools (6). Image Credit: Bruker Optics
What are the most challenging samples for spectroscopy?
When we talk about challenging samples in IR or Raman microscopy, the first thing to remember is that no two samples are ever the same. They can vary widely in particle count, size distribution, levels of organic contamination, and overall matrix complexity. All of that makes standardization difficult.
One particularly demanding scenario is a heavily loaded filter with a very high particle density. Filter loading also varies enormously by sample type, and while drinking water may yield only a handful of particles, marine or soil samples can easily produce thousands.
Regardless of technique, particles must never stack on top of each other. While full filter imaging can spatially resolve agglomerated particles lying side by side, stacked particles are a different problem: the spectrometer collects a mixed spectrum from all layers simultaneously, making correct chemical identification and size measurement impossible.
Beyond that, IR and Raman respond very differently to high particle counts. IR imaging always scans the full filter surface, so measurement time stays constant regardless of particle load. For a 25 mm filter, we are looking at 3.5 hours for FT-IR imaging, and roughly 10 minutes for IR Laser imaging.
Raman measurement times, by contrast, directly scale with the number of particles analyzed. At roughly two seconds per particle, a filter carrying 10,000 particles already takes close to six hours of acquisition time. While high particle counts are less problematic in drinking water analysis or can be managed through aliquoting, a fundamental difference remains: at these speeds, Raman collects only a single point per particle, while IR delivers spatially resolved chemical data across the entire particle surface at 5 µm resolution.
It is worth noting that Raman imaging is also possible, e.g. by ultra-fast Raman line imaging. However, this comes at a significant cost: a complete 25 mm filter would require approximately 22 hours of measurement time at a comparable spatial resolution to IR (5 µm).
Another complication is that microplastic spectra rarely resemble pristine reference materials. Many particles carry signatures of environmental aging, whether from hydrolytic, thermal, or UV-induced degradation. On top of that, additives or surface contamination can contribute additional spectral features.
These factors distort the spectra, and unless they're properly accounted for during evaluation, accurate polymer classification becomes difficult. However, AI-based evaluation algorithms trained on real microplastics data and generated by leading research groups worldwide are a big help. They allow for reliable polymer classification even when spectra are affected by aging or contamination.
With Raman microscopy, there's an additional layer of complexity: fluorescence. Particle fluorescence can overwhelm the Raman signal and make routine analysis more challenging. In comparison, IR microscopy tends to be more robust and significantly faster, which is why it has become the standard technique for many routine applications.
Once again, the analytical strategy is key. We adopt a technology-neutral approach because, as a provider of FTIR, IR Laser (QCL), and Raman solutions, Bruker emphasizes informed method selection and data evaluation tailored to the specific challenges of each unique sample.
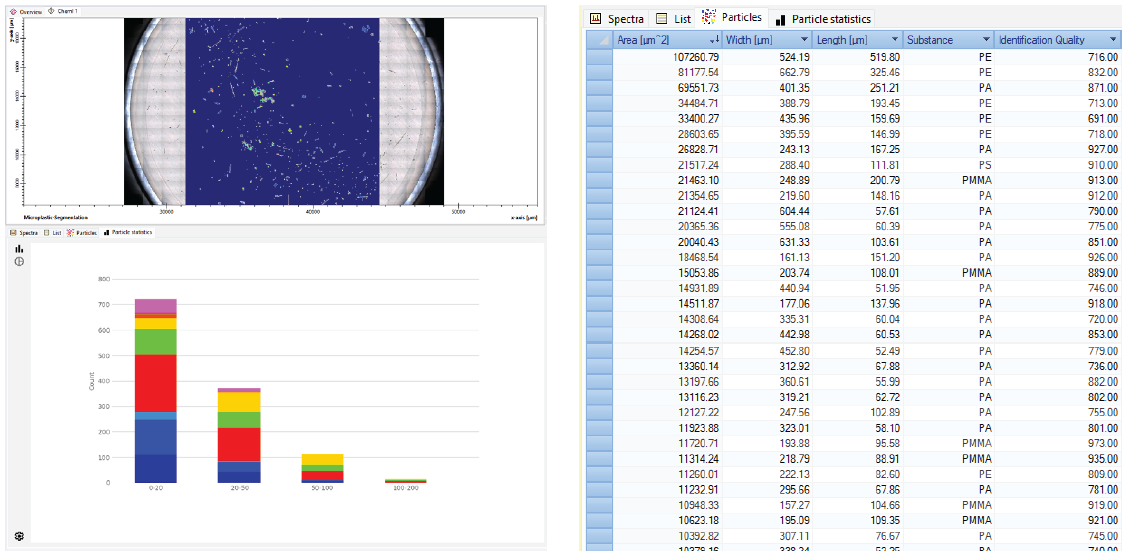
Analysis of IR imaging data of a complete filter using infrared (IR) imaging. Substance classes are assigned specific colors for visualization as bar or pie charts. A comprehensive list of particles, along with size, substance, and identification quality is provided. Image Credit: Bruker Optics
You have mentioned analytical strategy twice, but how exactly does the analytical chain change depending on which instrumentation is used?
IR and Raman may be complementary techniques, but the way they detect and measure particles is fundamentally different.
FT-IR and IR Laser (QCL) imaging are both based on chemical contrast. As said before, the entire filter is scanned systematically, and particles are detected directly through the chemical information from the spectra. This is a significant advantage: no particle is missed because of low visual contrast.
Raman microscopy works differently. Here, particles are first located using the optical image, either brightfield or darkfield, depending on the system. This optical detection step enables a much finer spatial resolution, typically around 1 µm, and, in some scenarios, even into the nanometer range.
Spectra are then collected at selected points on those particles, or in case of some systems, an average Raman signal is acquired across the complete particle. However, optical detection introduces a blind spot: particles with low visual contrast against the filter background may simply be overlooked, regardless of their chemical composition.
From there, the approaches diverge further. In IR imaging, the same spectral data used for particle detection also drives size and shape characterization as well as chemical identification, so everything comes from one consistent source.
In Raman microscopy, size and shape are derived from the optical image, while the spectra contribute only chemical identification. This means that particle geometry in Raman is inherently tied to the quality and contrast of the optical image, introducing an additional source of variability that IR imaging does not face.
In the end however, both provide what the user demands: extensive particle statistics, identification and answers to size and shape.
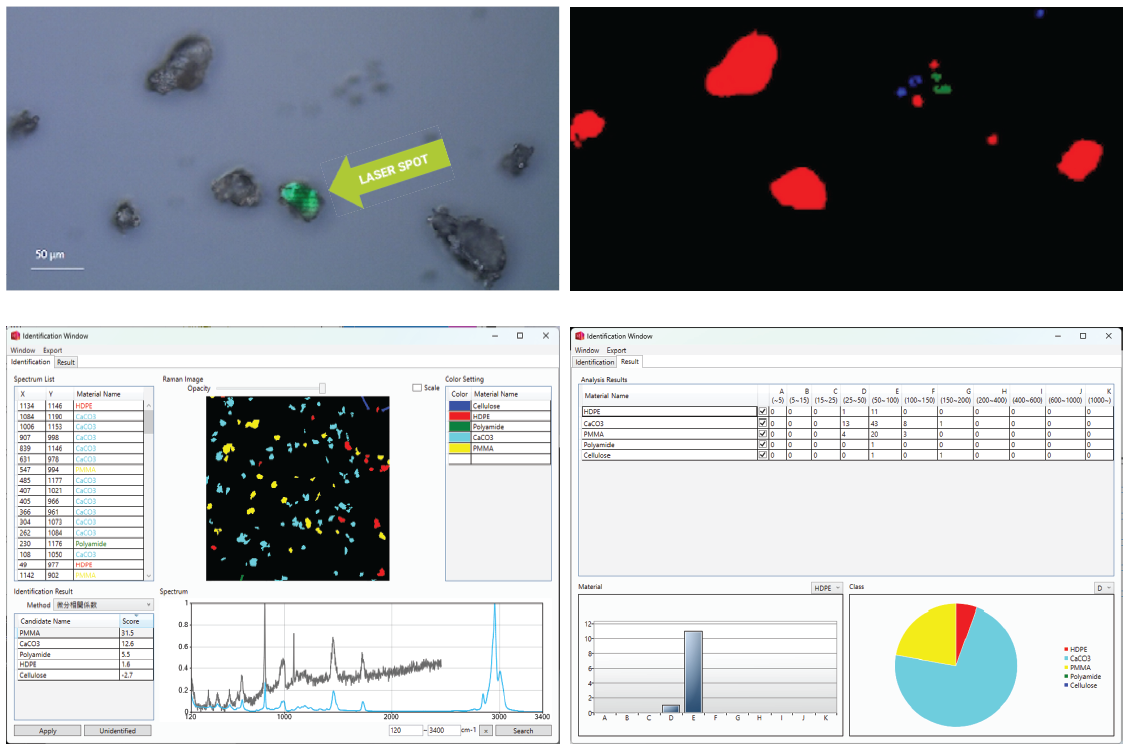
With special Raman microscopes, users can rapidly “flash” the laser across the complete particle surface (top left), creating a representative average Raman spectrum instead of acquiring only a single measurement point, creating a real-time chemical map (top right). At the bottom, particle evaluation and software output are shown, along with the complete Raman image and according spectra, as well as particle statistics like identity and size (right). Image Credit: Bruker Optics
What are the key factors when guiding customers in questions of instrumentation?
Most importantly, it’s about managing expectations. In microplastics analysis, there is no “one size fits all”, there is no “silver bullet”, and definitely no “holy grail”. Each technology has its advantages, and our role is to read the requirements and assemble a fit-for-purpose solution that feels like the right one.
For routine users, such as contract analysis laboratories, the priority is often throughput, robustness, and automation, along with the ability to analyze large numbers of samples reproducibly and efficiently. For research users, flexibility plays a much larger role, as instrumentation is frequently used for method development, new sample types, or adjacent scientific questions beyond microplastics alone.
For this reason, Bruker approaches instrumentation on a case-by-case basis.
Our application specialists work closely with users to evaluate their samples, laboratory environment, and analytical objectives. This often includes feasibility studies using real customer samples, ensuring that recommendations are based on realistic performance rather than theoretical specifications.
Our approach is reinforced by collaboration with leading research institutions, such as the Alfred Wegener Institute and the University of Bayreuth, as well as by partnerships for large-scale routine testing, for example with EUROFINS Hungary.
Such key users apply Bruker solutions in demanding environments and provide direct feedback that sharpens our analytical tools. This close interaction is particularly important to identify trends and be able to react to them.
Ultimately, guidance is not about ‘prescribing’ a single instrument; it is about selecting the right strategy and supporting users with solutions that evolve alongside the science.
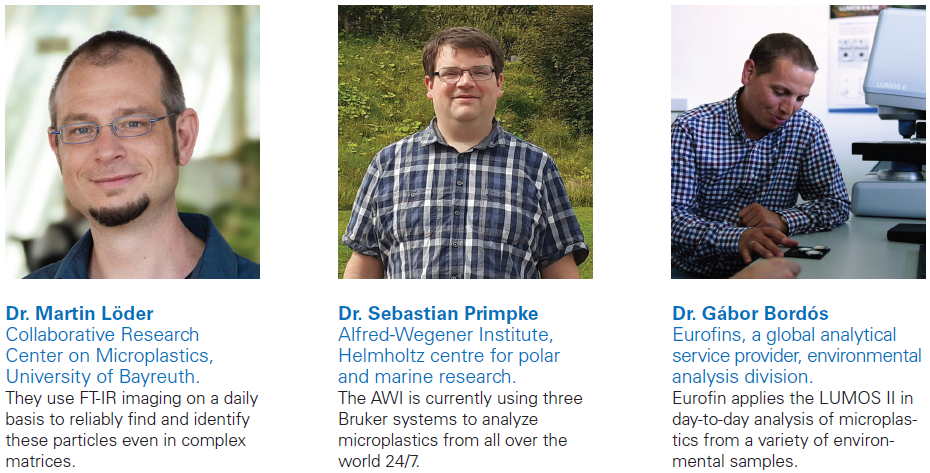
Three key reference customers applying Bruker Solutions in routine and research microplastics analysis. Image Credit: Bruker Optics
Where do you see the biggest opportunities for improving microplastics analytics with these Bruker platforms?
Microplastics research is still a relatively young field, but it has matured rapidly. One of the biggest opportunities lies in the transition from exploratory studies toward robust, scalable, and standardized analytical workflows with a high degree of automation.
Unlike most vendors, who offer only one or two spectroscopic platforms, Bruker covers the full range of particle-driven techniques:
- FT-IR imaging
- IR Laser (QCL) imaging
- Raman microscopy and imaging
With Bruker, a technology-neutral approach is genuinely possible. Our guidance is never constrained by portfolio gaps because for particle-driven microplastics analysis, there simply are none.
This comprehensive perspective enables us to identify improvements with the greatest impact, particularly in automation and workflow integration, which reduce operator dependence and improve reproducibility.
One major opportunity is the development of standardized, application-specific workflows. By embedding microplastics expertise directly into measurement and evaluation routines, complex analyses become more reliable and easier to implement in everyday laboratory practice.
This is increasingly important as analysis moves from research settings into routine monitoring. Artificial intelligence also plays a key role, particularly given the large and complex datasets generated in these studies.
Meaningful interpretation depends on consistent particle identification and robust statistical treatment. AI-supported analysis tools enable efficient handling of real-world spectral variability, including aging effects and additives.
Finally, Bruker sees major opportunities in advancing emerging technologies at the interface of microplastics and nanoplastics. A great example of this is nanoelectromechanical infrared spectroscopy (NEMS-FTIR), a new approach that might help us characterize nanoplastics within the picogram range.
We will keep leveraging complementary spectroscopic methods to identify where current techniques reach their limits and where meaningful improvements are possible.
About the Speaker

Dr. Alexander Staub holds a PhD in Chemistry from the Karlsruhe Institute of Technology (KIT), where he specialized in instrumental analytics. In 2022, he joined Bruker Optics as a Product Manager for microscopy solutions. Since 2024, he has served as a subject matter expert in microplastic analysis, focusing on the further development of micro spectroscopic IR and Raman solutions tailored to the specific challenges and requirements of particle applications.

This information has been sourced, reviewed and adapted from materials provided by Bruker Optics.
For more information on this source, please visit Bruker Optics.
Disclaimer: The views expressed here are those of the interviewee and do not necessarily represent the views of AZoM.com Limited (T/A) AZoNetwork, the owner and operator of this website. This disclaimer forms part of the Terms and Conditions of use of this website.