Cycling batteries until failure is highly time-consuming and can postpone analysis of data essential to developing new battery chemistries. One particularly persistent difficulty is assessing the activity of parasitic reactions, which may substantially affect the performance and service life of lithium-ion batteries.
In situ electrochemical calorimetry is a principal method for examining these parasitic reactions. The Battery Cycler Microcalorimeter solution integrates sensitive isothermal microcalorimetry with electrochemical measurements.
This article describes how this solution has been applied to determine the parasitic power of a Panasonic NCR18650GA cell. These results can support cell-quality assessment, active-material formulation, additive-impact studies, investigation of solid electrolyte interphase formation and growth, and the development of cycle and calendar-life prediction models.
Introduction
The cycle life, efficiency, and overall quality of a lithium-ion battery (LIB) depend largely on the reversibility of the electrochemical reactions during charging and discharging.1 Although cycle life can be established relatively simply from an analytical standpoint, it remains a significant bottleneck in testing workflows.2 Cycling a cell until failure may require several months, greatly reducing research speed and delaying information needed for quality control.
Current research increasingly emphasizes diagnostic characteristics that can reliably forecast long-term behavior.2,3 One important example is the examination of parasitic reactions, which have been linked to greater capacity loss, lower coulombic efficiency, and premature cell failure.1,2,4,5
The term ‘parasitic reaction’ broadly describes any chemical or electrochemical side reaction that occurs within a battery. Examples include solvent decomposition, lithium plating, SEI (solid electrolyte interphase) growth, SEI decomposition, and self-discharge.5
Coulombic efficiency is the conventional approach for estimating the energy lost during a battery cycle, with such losses generally attributed to parasitic reactions (Equation 1).
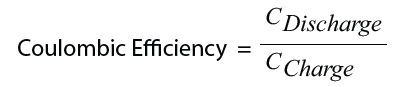 |
(1) |
Although coulombic efficiency is informative, it only represents energy lost through electrochemical side reactions. Because parasitic reactions in a lithium-ion battery are diverse and complex, Coulombic efficiency does not capture the complete behavior of the chemical and electrochemical processes.2,6
A second analytical method therefore needs to be combined in situ with electrochemistry to fully measure parasitic-reaction activity during cycling. The leading approach is to pair high-resolution isothermal microcalorimetry with established electrochemical methods.1,2,4,5,7
Electrochemical calorimetry assesses the heat-flow behavior of a battery while it is actively cycling. Despite its strength, complicated and laborious data processing has limited its routine utility.
Usually, this procedure requires hardware modifications to accommodate the experiments; synchronizing settings and start times across two instruments with different software interfaces; combining the resulting files; and completing calculations before the first plot can be viewed.
TA Instruments’ Battery Cycler Microcalorimeter solution simplifies this workflow by integrating the calorimeter and potentiostat at both the hardware and software levels.
The Battery Cycler Microcalorimeter records a battery’s heat-flow behavior in real time using common cell formats, including coin, 18650, and pouch cells. Experiments may be conducted across different temperatures and cycling conditions.
Time stamps applied to calorimeter and potentiostat data enable accurate correlation of thermal events with electrochemical stimuli. TAM Assistant, TA Instruments’ data-acquisition and analysis software, automatically performs calculations that separate the thermal contribution of parasitic reactions (parasitic power) from the total heat-flow signal.
This article applies the TA Instruments Battery Cycler Microcalorimeter solution to examine battery efficiency and parasitic reactions in a Panasonic NCR18650GA cell.
Experimental
The Battery Cycler Microcalorimeter solution combines the BioLogic VSP-300 Potentiostat, a high-precision potentiostat, with the TA Instruments TAM IV isothermal microcalorimeter. TAM Assistant operates both instruments and automatically links heat-flow events with electrochemical data in the output files, as illustrated in Figure 1.
The TAM IV’s pre-wired lifters establish electrical contact between the battery and the potentiostat while reducing noise from ambient thermal fluctuations. Spring clips positioned at the upper (+) and lower (-) terminals hold the battery securely against the lifter; soldering and additional electrical isolation are unnecessary.
In the two-electrode arrangement, a four-wire connection is made to the battery: two wires carry current, and two measure the (+/-) voltage. These wires terminate in a keyed connector that connects via a length-adjustable cable to the potentiostat leads. Figure 2 presents the design elements of the Macrocalorimeter lifter used with 18650 battery cells.
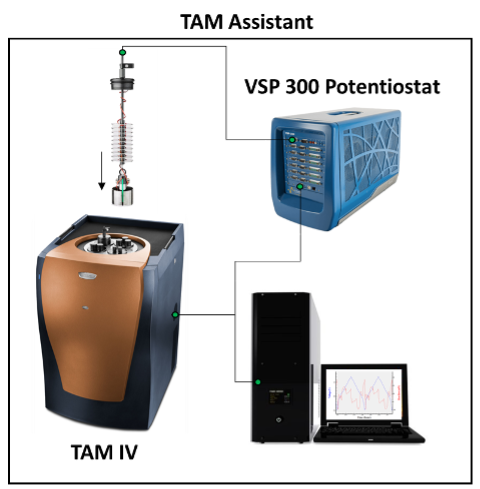
Figure 1. Battery Cycler Microcalorimeter Solution seamlessly integrates TA Instruments’ TAM IV isothermal microcalorimeter with BioLogic’s VSP-300 Potentiostat. Image Credit: TA Instruments
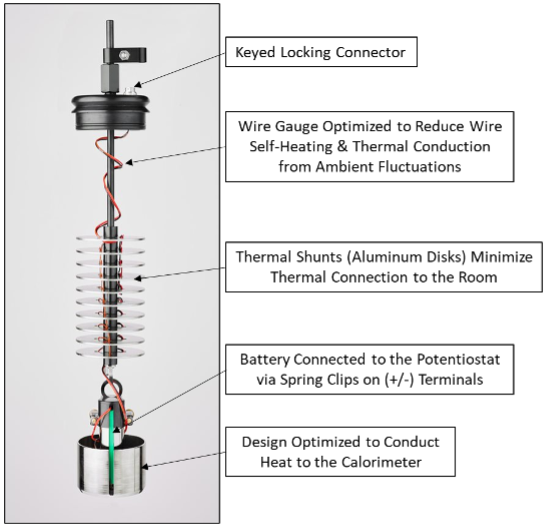
Figure 2. Pre-wired 18650 Battery Lifting Tool for the macrocalorimeter. The cable that interfaces with the VSP-300 potentiostat through the keyed connector is provided but not shown. Image Credit: TA Instruments
Calibration
The system uses an external, battery-shaped calibration heater available for each lifter type. These heaters reproduce the dimensions of an actual cell and include a 1000 Ω high-precision resistor that produces a known heat output. TAM Assistant provides several experiment wizards, including a calibration wizard that guides the operator through the procedure.
For calibration, the calibration heater is placed in the lifter and loaded into the calorimeter according to the standard operating procedure in the provided guide. The heater is allowed to equilibrate thermally with the bath temperature, and the baseline is allowed to stabilize.
When instructed, the potentiostat delivers a current pulse, causing the calibration battery to produce a known amount of heat. Figure 3 displays the gain-calibration results file, in which voltage and heat-flow signals are plotted against time.
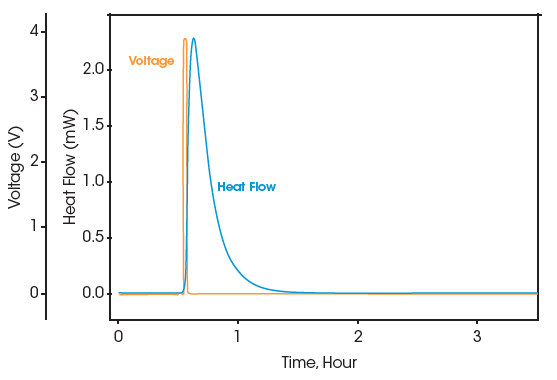
Figure 3. Gain calibration with external battery-shaped calibration heater. Image Credit: TA Instruments
This procedure provides both gain and offset values. Before shipment, TA Instruments performs temperature-dependent calibrations on each empty calorimeter at its facility. Any modification to the calorimeter arrangement, including adding the lifter, causes the calibrated value to shift.
The gain factor compensates for these changes and generates a gain constant specific to the operator’s configuration. The offset represents the difference between the baseline signal and zero and is automatically corrected after calibration.
Determination of Parasitic Heat on an 18650 LIB
The TAM IV bath was adjusted to 40 °C and stabilized for 24 hours. A 3400 mAh Panasonic NCR18650GA LIB cell was placed in the battery lifter and inserted into the calorimeter using the standard procedure. To condition the battery at the testing temperature, it was precycled for 10 cycles between 3 and 4.2 V at 250 mA (10 to 20 cycles are recommended).
A 24-hour rest period then stabilized the battery chemistry and allowed thermal equilibrium. For optimal results, parasitic heat should be measured using slow charge rates (C-rates).
The cell was therefore cycled at 172 mA (C/20) for five cycles between 3 and 4.2 V, with a one-hour rest interval between every charging and discharging step. TAM Assistant’s Battery Cycler Wizard programmed and ran the experiment.
Theoretical Background
During battery cycling, the heat-flow signal is represented by Equation 2.1,5,7
| QTotal = QImp + QEnt + QPar |
(2) |
Where:
- QTotal denotes total heat flow
- QPar denotes parasitic power
- QImp denotes impedance power
- QEnt denotes entropic power
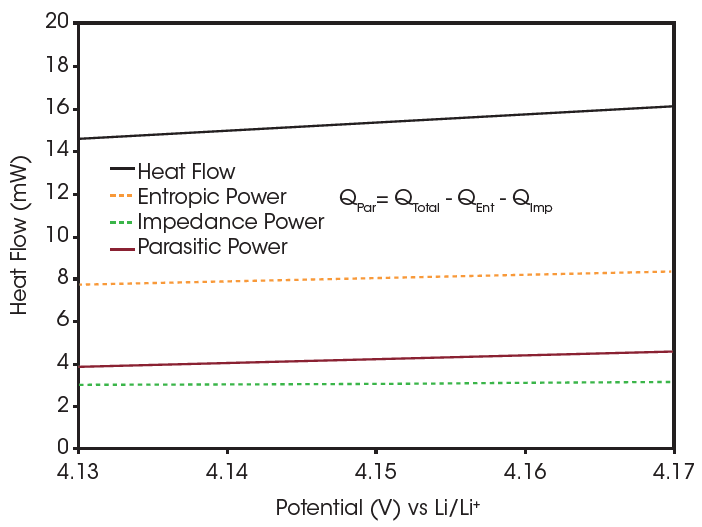
Figure 4. The deconvoluted heat-flow signals are shown relative to the total heat-flow signal. Image Credit: TA Instruments
The main signal of interest is QPar, or parasitic power. It represents the combined thermal energy generated by irreversible side reactions inside a battery. Isolating it from the total heat flow requires subtracting the impedance power (QImp) and the entropic power (QEnt).
Entropic power is the heat flow associated with reversible entropy changes. It generally makes the largest contribution to total heat flow during charging or discharging, as shown in Figure 4.
This power mainly arises from lithium intercalation/deintercalation and related structural changes in active materials, including expansion of graphite layers. Because these processes are reversible, their heat flows are reversible as well.
Consequently, entropic power during charging should have the same magnitude but opposite sign as that during discharging.5 Equation 3 sums the integrated total heat flows across a complete cycle to eliminate QEnt from QTotal, leaving QPar and QImp.
 |
(3) |
Here, Q is the heat-flow signal, t is time, and the subscripts d and c indicate discharging and charging, respectively.
Impedance power is the waste heat produced when current passes through a resistive material, a phenomenon also known as Joule heating. It can be calculated from electrochemical measurements using Equation 4.
In this expression, I is the applied current and η is the overpotential.
The overpotential is the difference between open-circuit voltage and voltage under load. Although applied current remains constant, overpotential changes with state of charge.
It can be measured directly by introducing open-circuit pulses at regular intervals, or estimated by plotting voltage against capacity and measuring the hysteresis between charge and discharge curves. For a complete cycle, mean impedance power can be obtained with Equation 5.
 |
(5) |
Here, I is the applied current, and V is the voltage during charging or discharging.
This signal is consistently exothermic, but its effect can be reduced by applying slow C-rates. After the average impedance and entropic powers have been established, Equation 6 determines the average parasitic power per cycle.
| QPar,cycle = QTotal,cycle - QImp,cycle - QEnt,cycle |
(6) |
By definition, QEnt,cycle equals zero.
Results and Discussion
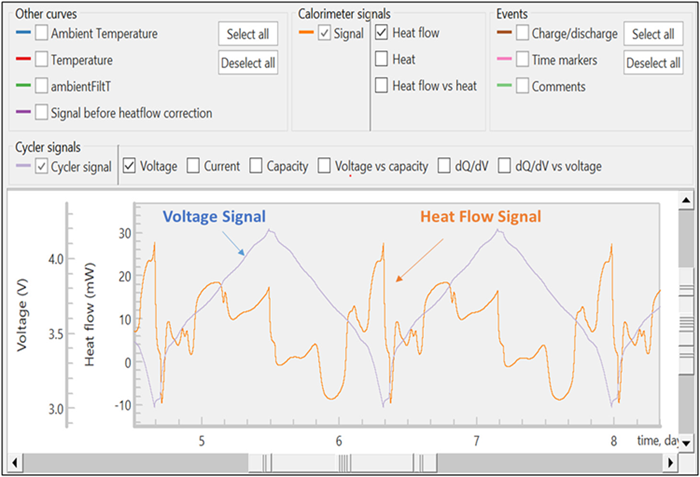
Figure 5. TAM Assistant results file showing the time-correlated voltage and heat-flow signal of a 3400 mAh Panasonic NCR18650GA LIB cell at C/20. Image Credit: TA Instruments
Figure 5 presents the unprocessed heat-flow and voltage signals. Every raw signal includes a timestamp, allowing the electrochemical and calorimeter measurements to be matched accurately. Voltage, current, and heat-flow signals are visible during an active experiment; however, calculated quantities become available only after the experiment is complete.
Using these raw measurements, TAM Assistant automatically determines key quantities and displays them in either a table or plot. Figure 6 illustrates the plotting window, including multiple x-axis choices on the right and numerous y-axis choices near the top. The software can overlay calculated and raw signals, compare separate cycles, and distinguish charging from discharging.
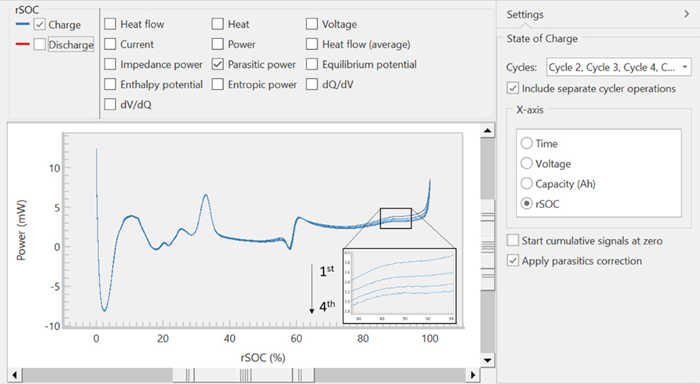
Figure 6. Parasitic power vs. relative state of charge with four cycles overlaid using the TAM Assistant plotting options. Image Credit: TA Instruments
These functions were intended to provide flexibility, accelerate analysis, and simplify operation so operators can identify important trends and features more efficiently.
Figure 6 shows charging-branch parasitic power across four cycles as a function of relative state of charge (rSOC). Spikes at the upper and lower rSOC limits are artifacts caused by the natural asymmetry near the ends of the voltage and heat-flow curves. These artifacts are known as edge effects.5
Examining the overlaid curves more closely shows that parasitic power falls with each cycle, consistent with the conventional formation of a passivation layer such as the SEI.8
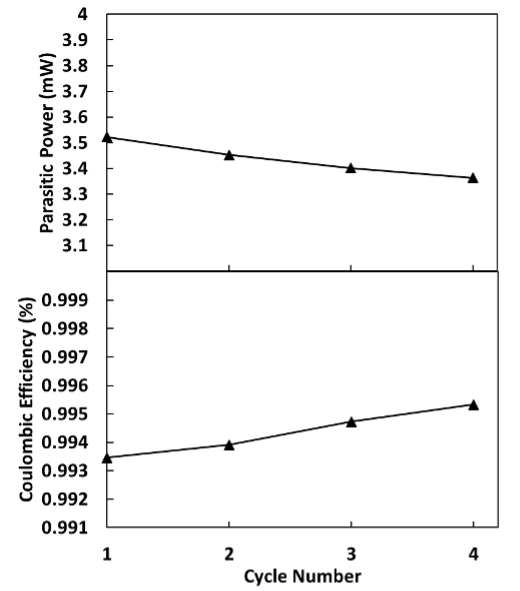
Figure 7. The average parasitic power (top) and coulombic efficiency (bottom) vs. cycle number. Values used to make this plot were automatically calculated by TAM Assistant and presented in a table. Image Credit: TA Instruments
Trends are also apparent when several cycles are considered together. Figure 7 presents average parasitic power and coulombic efficiency over four cycles. As parasitic power declines, coulombic efficiency rises, consistent with earlier studies.5
This result is theoretically expected because the two metrics describe the same event from opposite perspectives. Coulombic efficiency measures electrochemical efficiency, whereas parasitic power measures inefficiency from both chemical and electrochemical side reactions. Monitoring coulombic efficiency is useful because it can verify the thermal measurements, as demonstrated in Figure 7.
Conclusions
Measuring parasitic activity is essential for evaluating efficiency and quality and for clarifying the underlying chemistry of lithium-ion batteries. The TA Instruments Battery Cycler Microcalorimeter solution was applied to assess parasitic power in a Panasonic NCR18650GA cell. TAM Assistant integrates and controls the thermostat, calorimeters, and potentiostat, increasing the practicality and ease of use of battery calorimetry.
Across multiple cycles, the system measures patterns such as rising coulombic efficiency alongside falling parasitic power. These measurements can help researchers evaluate new active-material formulations, determine how additives reduce parasitic activity, investigate the SEI, and identify cells with unusually high parasitic activity during quality-control screening.
References and Further Reading
- Krause, L.J., Jensen, L.D. and Dahn, J.R. (2012). Measurement of Parasitic Reactions in Li Ion Cells by Electrochemical Calorimetry. Journal of The Electrochemical Society, 159(7), pp.A937-A943. DOI:10.1149/2.021207jes. https://iopscience.iop.org/article/10.1149/2.021207jes/meta.
- Burns, J.C., et al. (2013). Predicting and Extending the Lifetime of Li-Ion Batteries. Journal of The Electrochemical Society, 160(9), pp.A1451-A1456. DOI:10.1149/2.060309jes. https://iopscience.iop.org/article/10.1149/2.060309jes/meta.
- Xiong, W., et al. (2023). Early prediction of lithium-ion battery cycle life based on voltage-capacity discharge curves. Journal of Energy Storage, 62, p.106790. DOI:10.1016/j.est.2023.106790. https://www.sciencedirect.com/science/article/pii/S2352152X23001871.
- Downie, L.E., Hyatt, S.R. and Dahn, J.R. (2015). The Impact of Electrolyte Composition on Parasitic Reactions in Lithium Ion Cells Charged to 4.7 V Determined Using Isothermal Microcalorimetry. Journal of The Electrochemical Society, 163(2), pp.A35-A42. DOI:10.1149/2.0081602jes. https://iopscience.iop.org/article/10.1149/2.0081602jes/meta.
- Krause, L.J., Jensen, L.D. and Chevrier, V.L. (2017). Measurement of Li-Ion Battery Electrolyte Stability by Electrochemical Calorimetry. Journal of The Electrochemical Society, 164(4), pp.A889-A896. DOI:10.1149/2.1651704jes. https://iopscience.iop.org/article/10.1149/2.1651704jes/meta.
- An, S.J., et al. (2016). The state of understanding of the lithium-ion-battery graphite solid electrolyte interphase (SEI) and its relationship to formation cycling. Carbon, 105, pp.52–76. DOI:10.1016/j.carbon.2016.04.008. https://www.sciencedirect.com/science/article/pii/S0008622316302676.
- Kunz, A., et al. (2022). Time-Resolved Electrochemical Heat Flow Calorimetry for the Analysis of Highly Dynamic Processes in Lithium-Ion Batteries. Journal of The Electrochemical Society, 169(8), p.080513. DOI:10.1149/1945-7111/ac8625. https://iopscience.iop.org/article/10.1149/1945-7111/ac8625/meta.
- Luchkin, S.Y., et al. (2020). Solid-electrolyte interphase nucleation and growth on carbonaceous negative electrodes for Li-ion batteries visualized with in situ atomic force microscopy. Scientific reports, DOI:10.1038/s41598-020-65552-6. https://www.nature.com/articles/s41598-020-65552-6.

This information has been sourced, reviewed, and adapted from materials provided by TA Instruments.
For more information on this source, please visit TA Instruments.