Isothermal microcalorimetry is a straightforward method for determining how electrolyte additives influence the parasitic reactions produced by lithium-ion battery cells as a function of state of charge.
In this study, a high-resolution TAM microcalorimeter equipped with 12 microcalorimeters was used to measure and quantitatively compare the heat flow of lithium-ion battery cells containing different concentrations of electrolyte additives.
All other conditions were kept constant, meaning that differences in measured heat flow directly reflected differences in parasitic heat generated by the additives. Expressing these differences as a function of state of charge provides a rapid and convenient way to determine where parasitic reactions are reduced and the extent of that reduction.
As an illustrative example, the effects of different concentrations of vinylene carbonate (VC) were examined in LiCoO2/ graphite batteries. The results showed that VC reduced parasitic reactions above 3.9 V, with the reduction becoming greater as the state of charge increased. The methods and data described here are publicly available and are reproduced with permission.1
Introduction
Lithium-ion batteries are increasingly used in applications requiring high energy density and long operating life. Electrolyte additives are commonly used because they can extend calendar and cycle life while reducing parasitic reactions between the electrolyte and electrode materials.
However, the mechanisms by which these additives operate, including the specific stages of the charge-discharge cycle at which they provide benefits, are not fully understood. Consequently, determining the voltage dependence of individual additives or additive combinations is important and can substantially improve understanding of how these substances extend the lifetime of lithium-ion batteries.
In recent years, isothermal microcalorimetry has been combined with electrochemical measurements to investigate the thermal behavior of different lithium-ion battery chemistries.2–9 More recently, Krause et al. demonstrated how this approach could separate different contributions to total thermal output and isolate parasitic energy.10
In the present study, heat flow was compared qualitatively and quantitatively between batteries containing different concentrations of additives. Since all other conditions were identical, differences in measured heat flow were attributed to differences in parasitic heat.
Representing this difference as a function of state of charge provides a rapid method for identifying both the location and magnitude of parasitic reactions occurring between electrolyte and electrode materials.
As an illustrative example, the effects of different concentrations of vinylene carbonate (VC) were investigated in LiCoO2/ graphite batteries. VC is a widely used electrolyte additive that has been shown to extend battery life 11.
Experiment
Machine-made 225 mAh LiCoO2 (LCO)/graphite pouch batteries supplied by Pred Materials Co., Ltd. were received dry. The pouches were vacuum-sealed with electrolytes containing different concentrations of VC, supplied by Novolyte Technologies (now BASF).
The additive concentrations were 0%, 0.5%, 2%, and 4% by weight. The electrodes were accelerated at 50 times gravity for 20 minutes to promote centrifugal wetting. The batteries were then formed; held at 1.5 V and 40 °C for 24 hours; charged at 2 mA for 10 hours; charged to 4.2 V at 15 mA; and discharged to 3.775 V at 15 mA.
The batteries were subsequently opened to release the generated gas and then resealed. Battery charging and discharging in the microcalorimeter were conducted using an automated Maccor Series 4000 testing system (Maccor Inc.).
Isothermal heat-flow microcalorimetry measurements were performed using a TAM microcalorimeter (TA Instruments-Waters LLC) at an uncertainty of less than ± 1 μW and a temperature of 40.0 °C.10 The instrument noise level was approximately 10 nW, while baseline drift remained below 500 nW throughout the experiments.
Results and Discussion
Heat Flow During Cycling
The microcalorimeter cycling protocol used for the tested batteries included a representative section of the overall cycling procedure. Figure 1a presents the measured heat flow, whereas Figure 1b shows the corresponding voltage profiles.
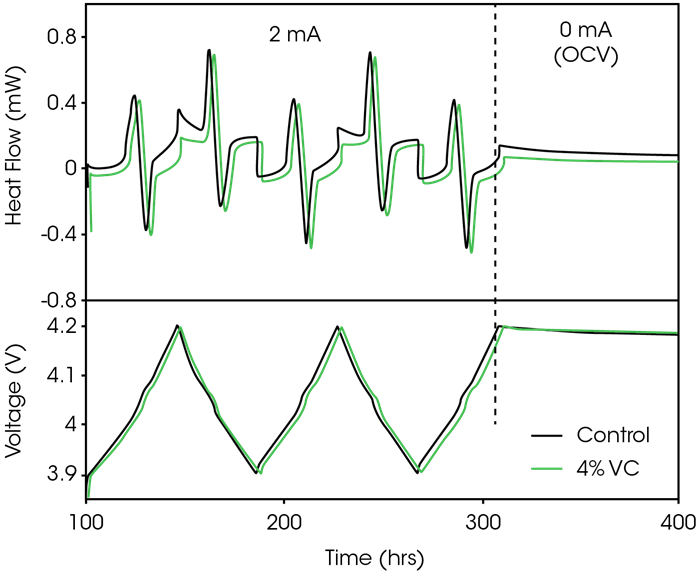
Figure 1. Representative portion of the experimental cycling protocol for all cells tested. Only data for control (black) and 4% VC (green) are shown for simplicity. Panel (a) shows the measured heat flow and panel (b) shows the corresponding voltage profile. Image Credit: Reproduced with permission from ECS Electrochem Lett., 2, A106-A109 (2013). Copyright 2013, The Electrochemical Society
For clarity, the figure only includes data from control batteries without VC and batteries containing 4% VC. The cycling protocol consisted of two distinct stages:
- Two cycles at 2 mA, charging to 4.2 V and discharging to 3.9 V
- A 100-hour open-circuit period beginning at 4.2 V
The heat flow measured during battery cycling results from three principal contributions: entropy, polarization, and parasitic heat from the cathode and anode.12 Entropic and polarization contributions depend on current, whereas parasitic heat is generally considered independent of current.
In both graphite and LCO, entropy changes substantially during charging and discharging because of graphite phase transitions and the ordered-disordered transition in LCO.13,14 These changes are the primary source of the reversible structure observed in the heat-flow profile in Figure 1a.7,9
Polarization contributes an approximately constant amount of heat during both charging and discharging. The remaining signal is therefore associated with parasitic heat flow.
The pouch batteries used in this experiment were manufactured to be nominally identical, differing only in the amount of VC added. Capacity variation between the batteries was below 1%. At sufficiently low current, the entropic and polarization contributions should be comparable among all batteries.
Therefore, differences in heat flow can be attributed primarily to differences in parasitic heat. Figure 1a shows that the battery containing 4% VC produced less heat than the control battery. Although not clearly visible in the figure, all batteries containing VC exhibited lower heat flow than the control cells.
The difference in heat flow varied with state of charge, demonstrating that isothermal microcalorimetry can readily identify the voltage dependence of parasitic reactions and the beneficial effects of VC and other additives. In this comparison, 4% VC substantially reduced parasitic reactions.
Even at the relatively low current used in the experiment, the heat flow generated by the pouch batteries was two to three orders of magnitude greater than the noise level of the TAM microcalorimeter. This large difference enabled highly precise discrimination between the batteries.
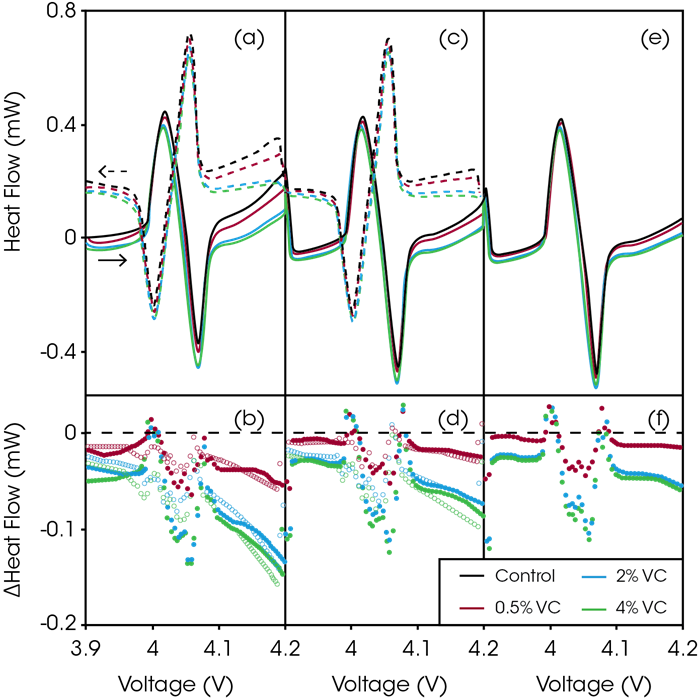
Figure 2. Panels (a), (c), and (e) show the heat flow as a function of voltage during low-rate, narrow-range (3.9–4.2 V) charge (solid) and discharge (dashed) for the first (a), second (c), and third (e) cycles for control (black), 0.5% VC (red), 2% VC (blue), and 4% VC (green). Panels (b), (d), and (f) show the corresponding difference in heat flow as a function of voltage between VC-containing cells and control during charge (solid) and discharge (open) for the first (b), second (d), and third (f) cycles. Image Credit: Reproduced with permission from ECS Electrochem Lett., 2, A106-A109 (2013). Copyright 2013, The Electrochemical Society
Figure 2 presents heat flow as a function of voltage for region 1 of the cycling protocol shown in Figure 1, corresponding to the 3.9–4.2 V range at 2 mA. Figure 2a shows heat flow during the first 2 mA charge-discharge cycle for batteries with increasing VC concentrations. As the voltage increased, VC addition clearly reduced heat flow; this effect was especially pronounced at voltages above 4.1 V.
Figure 2b shows the difference obtained by subtracting the heat flow of the control battery without VC from that of the battery containing VC as a function of voltage. This difference provides a useful measure of the reduction in parasitic heat produced by the additive. Across most of the voltage range, batteries containing VC exhibited lower heat flow.
However, from approximately 3.98–4.1 V, the difference was partly obscured by a small variation in the heat-flow profile associated with passage through the ordered-disordered transition in LCO.
The reduction in heat flow became increasingly pronounced at higher voltage, indicating that VC suppressed parasitic reactions occurring at the cathode. Even with 0.5% VC, heat flow at 4.2 V was reduced by 54 μW. At the same voltage, the reductions were 132 μW and 148 μW for batteries containing 2% and 4% VC, respectively.
The reduction in parasitic heat was nonlinear with additive concentration. The heat-flow difference between batteries containing 2% and 4% VC was very similar, suggesting that, for this battery chemistry, increasing the VC concentration beyond 2% provides limited additional benefit.
Figures 2c and 2d show the heat-flow-versus-voltage plots and corresponding differences for the second charge-discharge cycle between 3.9 and 4.2 V. During the full voltage range, heat flow from all four batteries decreased somewhat, and the differences in heat flow became smaller.
Figures 2e and 2f show the equivalent plots for the third and final charge. The heat-flow differences decreased again. As the number of cycles increased, the parasitic response declined as expected. After the third charge, the addition of 0.5%, 2%, and 4% VC reduced parasitic heat flow at 4.2 V by 15 μW, 54 μW, and 60 μW, respectively, compared with the control batteries.
Heat Flow Under Open-Circuit Conditions
Figure 3 shows the heat flow released while the same set of batteries remained under open-circuit conditions after being charged to 4.2 V, corresponding to step 2 in Figure 1. Because no current was applied during this period, the heat flow associated with parasitic reactions could be measured directly under open-circuit conditions.
A clear reduction in parasitic heat was observed as VC concentration increased, consistent with the results shown in Figure 2. The difference in heat flow between the batteries diminished over time during the open-circuit period.
For example, after five hours, the difference between the control battery and the battery containing 4% VC was 66 μW, whereas after 100 hours it had decreased to 31 μW. This behavior is consistent with the decrease in parasitic heat observed with increasing cycle number, or elapsed time, in Figure 2.
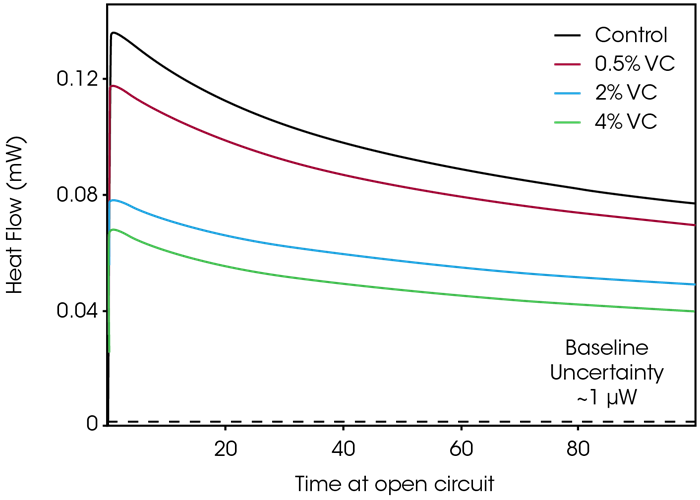
Figure 3. Heat flow for control (black), 0.5% VC (red), 2% VC (blue), and 4% VC (green) cells during 100 hours of open circuit conditions, starting from 4.2 V. Image Credit: Reproduced with permission from ECS Electrochem Lett., 2, A106-A109 (2013). Copyright 2013, The Electrochemical Society
Conclusion
Isothermal microcalorimetry is a powerful method for identifying the voltage range in which a particular additive or additive combination is most effective. It also supports improved understanding of electrolyte additives and assists in selecting suitable additive combinations for specific battery chemistries and operating conditions.
To demonstrate the capabilities of this technique, the effects of different VC concentrations were examined in full LCO/graphite batteries. VC substantially reduced parasitic responses at high potentials, indicating a reduction in parasitic reactions occurring at the cathode.
Acknowledgments
Produced using materials originally authored by L.E. Downie, K.J. Nelson, and J.R. Dahn at Dalhousie University.
References and Further Reading
- Downie, L.E., et al. (2013). The Impact of Electrolyte Additives Determined Using Isothermal Microcalorimetry. ECS Electrochemistry Letters, 2(10), pp.A106-A109. DOI:10.1149/2.010310eel. https://iopscience.iop.org/article/10.1149/2.010310eel/meta.
- Lu, W., et al. (2006). In Situ Thermal Study of Li1 + x [ Ni1 / 3Co1 / 3Mn1 / 3 ] 1 − x O2 Using Isothermal Micro-clorimetric Techniques. Journal of The Electrochemical Society, 153(11), p.A2147. DOI:10.1149/1.2349287. https://iopscience.iop.org/article/10.1149/1.2349287/meta.
- Lu, W., et al. (2007). Thermal properties of Li4/3Ti5/3O4/LiMn2O4 cell. 13th International Meeting on Lithium Batteries, 174(2), pp.673–677. DOI:10.1016/j.jpowsour.2007.06.199. https://www.sciencedirect.com/science/article/abs/pii/S0378775307014231.
- Lu, W., I. Belharouak, Liu, J. and Amine, K. (2007). Electrochemical and Thermal Investigation of Li4 / 3Ti5 / 3O4 Spinel. Journal of The Electrochemical Society, 154(2), pp.A114-A114. DOI:10.1149/1.2402117. https://iopscience.iop.org/article/10.1149/1.2402117/meta.
- Lu, W., et al. (2007). Isothermal calorimetry investigation of Li1+xMn2−yAlzO4 spinel. Electrochimica Acta, 52(19), pp.5837–5842. DOI:10.1016/j.electacta.2007.03.005. https://www.sciencedirect.com/science/article/abs/pii/S0013468607003635.
- Lu, W. and Prakash, J. (2003). In Situ Measurements of Heat Generation in a Li/Mesocarbon Microbead Half-Cell. Journal of The Electrochemical Society, 150(3), pp.A262-A266. DOI:10.1149/1.1541672. https://iopscience.iop.org/article/10.1149/1.1541672/meta.
- Kobayashi, Y., et al. (2002). Precise Electrochemical Calorimetry of LiCoO2/Graphite Lithium-Ion Cell. Journal of The Electrochemical Society, 149(8), p.A978. DOI:10.1149/1.1487833. https://iopscience.iop.org/article/10.1149/1.1487833/meta.
- Kim, J.-S., Prakash, J. and Selman, J.R. (2001). Thermal Characteristics of LixMn2O 4 Spinel. Electrochemical and Solid-State Letters, 4(9), p.A141. DOI:10.1149/1.1387224. https://iopscience.iop.org/article/10.1149/1.1387224/meta.
- Saito, Y., et al. (2001). Comparative study of thermal behaviors of various lithium-ion cells. Proceedings of the 10th International Meeting on Lithium Batteries, 97–98, pp.688–692. DOI:10.1016/S0378-7753(01)00702-9. https://www.sciencedirect.com/science/article/abs/pii/S0378775301007029.
- Krause, L.J., Jensen, L.D. and Dahn, J.R. (2012). Measurement of Parasitic Reactions in Li Ion Cells by Electrochemical Calorimetry. Journal of The Electrochemical Society,159(7), pp.A937-A943. DOI:10.1149/2.021207jes. https://iopscience.iop.org/article/10.1149/2.021207jes/meta.
- Burns, J.C., et al. (2011). The Impact of Varying the Concentration of Vinylene Carbonate Electrolyte Additive in Wound Li-Ion Cells. Journal of The Electrochemical Society, 159(2), pp.A85-A90. DOI:10.1149/2.028202jes. https://iopscience.iop.org/article/10.1149/2.028202jes/meta.
- Dahn, J.R., et al. (1985). Entropy of the intercalation compound LixMo6Se8 from calorimetry of electrochemical cells. Physical Review B, 32(5), pp.3316–3318. DOI:10.1103/physrevb.32.3316. https://journals.aps.org/prb/abstract/10.1103/PhysRevB.32.3316.
- Dahn, J.R. (1991). Phase diagram of Lix C6. Physical Review B, 44(17), pp.9170–9177. DOI:10.1103/physrevb.44.9170. https://journals.aps.org/prb/abstract/10.1103/PhysRevB.44.9170.
- Reimers, J.N. (1992). Electrochemical and In Situ X-Ray Diffraction Studies of Lithium Intercalation in Lix CoO2. Journal of The Electrochemical Society, 139(8), p.2091. DOI:10.1149/1.2221184. https://iopscience.iop.org/article/10.1149/1.2221184/meta.

This information has been sourced, reviewed and adapted from materials provided by TA Instruments.
For more information on this source, please visit TA Instruments.