Standard X-ray sources for lab-based instruments are Mg Kα or Al Kα, which offer photons with 1254.6 eV and 1486.6 eV energy, respectively.
The use of a monochromatic, Ag Lα X-ray source is demonstrated here, which uses the second-order diffraction of the same quartz crystals as those used for Al Kα; allowing it to be easily placed on the latest spectrometers.
The photon energy of Ag Lα is 2984.2 eV; about twice that of Al Kα (1486.6 eV). This greater energy results in not only the excitation of extra, higher binding energy, core lines for some elements, (Table 1), but also the option of the analysis of deeper layers, due to the reduction in attenuation length with increasing photoelectron energy2.
For instance, the inelastic mean free path (IMFP) of C 1s, binding energy 285 eV, using Al Kα X-rays is 3.14 nm at a kinetic energy (KE) 1201 eV, but for Ag Lα this is raised to 5.89 eV at KE 2699 eV3.
Table 1. Elements with core line binding energies in the range of Ag Lα X-rays, but not Al Kα (*at least one half of doublet)4
| Core Line |
Element |
| 1s |
Al Si P S Cl |
| 2s |
As - Mo |
| 2p |
Br - Ru |
| 3s |
Pr - Re |
| 3p* |
Sm - Tl |
| 3d* |
Tm - Rn |
The example provided below shows data from a single crystal MoS2 sample. In figure 1, spectra are displayed from the 'as introduced' using the Ag Lα (black) monochromatic X-ray sources and Al Kα X-ray source (red), with the spectra normalized to the Mo 3d peak intensity. It is instantly evident that the higher Mo 2p and S 1s peaks are stimulated using the higher photon energy.
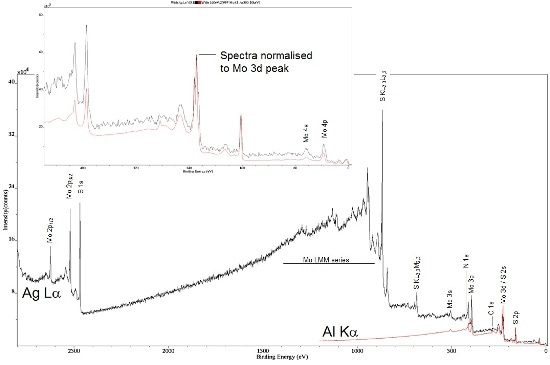
Figure 1. Survey spectra from 'as introduced' MoS2; a single crystal sample using Al Kα (red) and Ag Lα (black) X-rays. Inset shows expanded low BE range, with the two spectra normalized to Mo 3d peak intensities.
After characterization of the 'as introduced' sample, the surface was etched using the Ar gas cluster ion source, and using Ar1000+ at 10 keV beam energy, in an attempt to lessen surface damage relative to sputtering with monoatomic Ar+ ions. The schematic diagram below illustrates the interaction of a gas cluster with a perfect surface, where the damage caused by the impact is localized at the surface. In addition, the diagram shows the Mo 3d photoelectron escape depth for electrons excited with the Al Kα (red) and Ag Lα X-rays (blue).
Download the Application Note For More Information
As a result of the greater kinetic energy of the Mo 3d photoelectrons excited using the Ag Lα, the sample depth is nearly twice that of the Al Kα excited spectrum. The Mo 3d spectra illustrated in figure 2 are both obtained from the same sample after a 20 s etch cycle. It is noted that each of the Mo 3d spin-orbit split parts exhibit a doublet, relating to the sample’s chemistry. The curve fits of these envelopes are illustrated in figure 3.
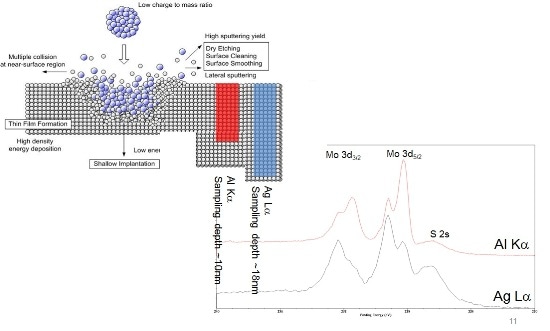
Figure 2. Schematic diagram of Arn+ ion cluster impact, with a surface and relative sampling depths using the two X-ray sources. The spectra show the Mo 3d/S 2s region recorded using Al Kα (red) and Ag Lα (black) X-rays.
The Mo 3d envelope has been fitted to two chemical states equivalent to the undisturbed MoS2, where the Mo 3d5/2 peak appears at 229.2 eV binding energy and the diminished metallic-like peak at 228.1 eV binding energy.
For the Al Kα excited spectrum, the ratio of Mo (IV) to Mo (0) is 0.43, which contrasts with a ratio of 1.25 for the Ag Lα excited spectrum. The difference in the ratio is explained by the increased sampling depth for the Ag Lα, so that additional undisturbed sub-surface is sampled with the higher excitation energy source. It is noted that the cross section of the S 2s, compared with the Mo 3d, is considerably different for the two X-ray sources.
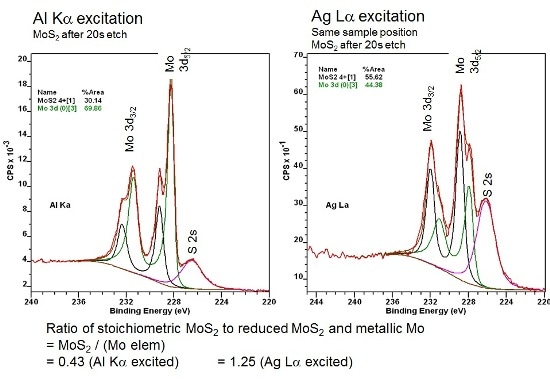
Figure 3. Curve fits for the Mo 3d/S 2s envelope of sputtered MoS2, using the Al Kα and Ag Lα excitation sources.
References and Further Reading
- K Yates & RH West, Surf. Interface Anal., 1983, 4, 5
- MP Seah & WA Dench, Surf. Interface Anal., 1979, 1, 2
- www.nist.gov
- X-Ray Data Booklet LBNL/PUB-490 Rev.2 Jan 2001