Detection limits of ppb (trace) or sub-ppb (ultratrace) range of concentrations are considered necessary for most gas purity applications. Atmospheric Pressure Ionization Mass Spectrometry (APIMS) is ideal to achieve these low levels of detection limits. For more than two decades, quadrupole-based APIMS has been used as the standard for research and industrial applications involving on-line detection of low-level components of gas mixtures.
APIMS instruments can regularly perform real-time component monitoring at the ppb and ppt level. A quadrupole-based APIMS system is capable of monitoring a variety of gases and gas mixtures, with the stability to deliver the long-term repeatability needed in many applications.
Experimental Procedure
The Limit of Detection (LoD) analysis has involved the use of the Process Insights VeraSpec Trace APIMS wherein a calibration gas and bulk gas are flown through a flow controller and then in to the API source. The bulk nitrogen is ionized by the API source using a Corona Discharge of 5kV. The ionized bulk gas, in turn, ionizes the analytical gas. The adsorption/desorption rates of molecular layers on the stainless steel inlet and source surfaces is optimized by heating all wetted surfaces.
After ionization, the ions are then passed through a small aperture, via a declustering region (2.5 x 10⁻⁶ torr) and a 19mm quadrupole mass filter. A pulse-counting electron multiplier (1.7 x 10- 7Torr) finally collects the ions. Figure 1 shows a schematic of the system, wherein ‘A’ is the Corona Discharge Region (~1 atm), ‘B’ is the Declustering Region (2.5 x 10⁻⁶Torr), and ‘C’ is the Quadrupole Region (1 x 10⁻⁷Torr)
The mass spectrometer is put into a slow scan mode, letting 30 seconds of dwell (measurement) time for each mass. Every precaution has been taken to improve the signal-to-noise in this system.
Figure 1. Schematic of APIMS System
Moreover, the inlet system is subjected to constant heat and continuous flow of bulk gas. This constant gas flow facilitates all wet surfaces to off-gas and to achieve equilibrium. The bulk gas is then passed through a getter-based purification system. The Lower Detection Limits (LDL) of Carbon Dioxide (m/z 44) is applied for the LoD calculations.
Experimental Results
The following formula is used to calculate the detection limits:
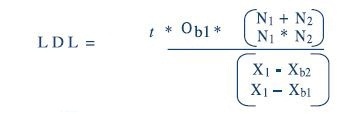
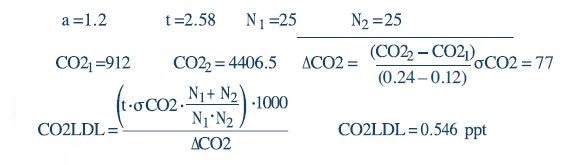
In the aforementioned equation, the t value is 2.58 for a 99% confidence level over an infinite number of measurements. As an adjustment for the degrees of freedom, 25 measurements are performed for N1 and N2. MathCAD calculations for LDL are as follows:
The raw data used for these calculations are summarized in Table 1:
Table 1. Results of Resolved Peak Experiment
| 0.2 scc/min Sample in 2 L/min N2 |
| |
m/z 44 |
m/z 45 |
| Average |
81729 |
2468 |
| Stdev |
6920 |
277 |
| RSD |
8.5% |
11.2% |
| Adj. Average (cps) |
912 |
28 |
| Adj. Stdev (cps) |
77 |
3 |
| Calc. Conc. (ppb) |
0.120 |
0.001 |
| 0.4 scc/min Sample in 2 L/min N2 |
| |
m/z 44 |
m/z 45 |
| Average |
394822 |
7077 |
| Stdev |
18952 |
813 |
| RSD |
4.8% |
11.5% |
| Adj. Average (cps) |
4406.5 |
79.0 |
| Adj. Stdev (cps) |
211.5 |
9.1 |
| Calc. Conc. (ppb) |
0.240 |
0.002 |
| Delta (cps/ppb) |
29120 |
42869 |
Figures 2 and 3 depict the calibration curves for m/z 44 and m/z 45 are plotted for linearity.
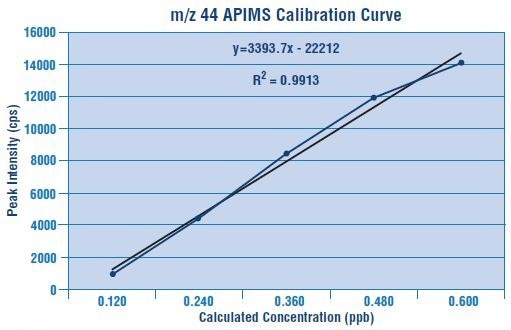
Figure 2. Calibration curve for m/z 44
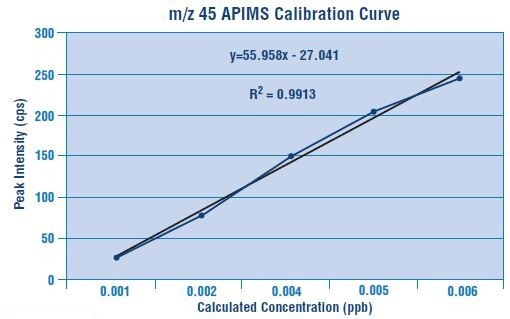
Figure 3. Calibration curve for m/z 45
The isotope ratio between m/z 44 and 45 estimated from the above data is roughly 3%. This error may be caused by several sources including:
- A tail from m/z 44 bleeding into m/z 45
- An interfering background peak at m/z 45
- An interfering peak at m/z 45 from a protonated carbon dioxide
These possibilities are explored as follows:
- An interfering peak at m/z 45 from a protonated carbon dioxide is discounted. The ideal source of a proton would be from protonated water, which would easily be observed at m/z 19. As there is no significant peak at m/z 19, it is unsure that carbon dioxide would be able to protonated adequately to influence the data considerably.
- An interfering background peak at m/z 45 can be analyzed by estimating the isotopic ratio from the deviations between two data points. Hence, there is chance that the data may be skewed by a background peak.
- Reducing the resolution of the quadrupole may avoid a tail from m/z 44. Once this test is performed, the calibration curve is completely rerun.
The results of Resolved Peak Experiment are summarized in Table 2.
Table 2. Resolved Peak Experiment Results
| 0.2 scc/min Sample in 2 L/min N2 |
| |
m/z 44 |
m/z 45 |
| Average |
216345 |
5930 |
| Stdev |
10243 |
960 |
| RSD |
4.7% |
16.2% |
| Adj. Average (cps) |
2415 |
66 |
| Adj. StDev (cps) |
114 |
11 |
| Calc. Conc. (ppb) |
0.120 |
0.001 |
| 0.4 scc/min Sample in 2 L/min N2 |
| |
m/z 44 |
m/z 45 |
| Average |
402952 |
8176 |
| Stdev |
15962 |
1025 |
| RSD |
4.0% |
14.3% |
| Adj. Average (cps) |
4497.2 |
91.2 |
| Adj. StDev (cps) |
178.2 |
11.4 |
| Calc. Conc. (ppb) |
0.240 |
0.002 |
| Delta (cps/ppb) |
17356 |
20884 |
| LDL (ppt) |
5.09 |
0.54 |
The estimated isotope ratio is roughly 2.7%, which is inaccurate though closer to the natural abundance. Taking into account the possibility of an interfering background peak at m/z 45, it is possible to analyze the Δ45/Δ44 for the narrowed resolution experiment. The outcome is an isotopic ratio of 1.20%. However, the isotopic must be ~1.18%. Hence, reducing the resolution and taking into account the deltas of the two data points would yield better results.
In the first set of data, evidence of a slight tail is observed from m/z 44 and some contribution from a background peak at m/z 45. Hence, a LDL is not estimated from the m/z 45 peak. This isotope peak would yield an artificially low detection limit. Figures 4 and 5 show the resultant calibration curves from this analysis.
Conclusion
The results show the flexibility and accuracy of the Process Insights VeraSpec Trace that not only allows the analysts to focus the equipment on the specific application, but also to perform troubleshooting and fundamental research in addition to process monitoring. The VeraSpec Trace system achieves soft ionization using the Corona Discharge API source. The soft ionization is suitable to monitor trace level molecules. With high signal transmission, the 19mm rod tri-filter quadrupole mass filter yields the maximum possible sensitivity and reproducibility for many applications.

This information has been sourced, reviewed and adapted from materials provided by Process Insights - Mass Spectrometry.
For more information on this source, please visit Process Insights – Mass Spectrometers.