Gel Permeation/Size Exclusion Chromatography (GPC/SEC) is typically used to characterize homopolymer molecular weight distributions through comparison of the elution profile of a polymer of interest to that of a known standard.
Sophisticated multi-detection GPC/SEC systems like Viscotek TDAmax can eliminate column calibration.
The Viscotek TDAmax consists of a concentration detector (RI or UV) and a light scattering detector (low angle light scattering (LALS), right angle light scattering (RALS)) to determine absolute molecular weights of each portion of the chromatogram. It also includes a bridge viscometer to measure the intrinsic polymer viscosity.
The Viscotek TDAmax can also integrate a second concentration detector to determine the composition of block copolymers. It can also provide additional information such as hydrodynamic radius and polymer branching by coupling the signals obtained from the different detectors.
Copolymer Characterization
This analysis used a Viscotek TDAmax system coupled to two ViscoGEL columns to characterize four synthetic copolymer samples. A linear copolymer was the first sample, whereas randomly branched copolymers were the remaining samples, designated as low branching (low-brch), high branching (high-brch), and medium branching (mid-brch). The elution of the samples in a THF solvent took place at a flow rate of 1mL/min in the GPC system.
The Viscotek OmniSEC software was used to calculate the Stokes radius, polymer intrinsic viscosity, and molecular weight for each of the copolymers. It also calculated the average branching and branching frequency using the Zimm-Stockmayer equations. The GPC results obtained for the linear and low branching copolymer samples are presented in Figure 1, showing a single population within the integration limits for the linear copolymer, but two populations for the branched copolymer. The results generated by the Viscotek OmniSEC software are summarized in Table 1.
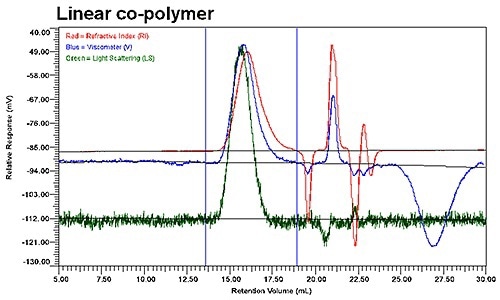
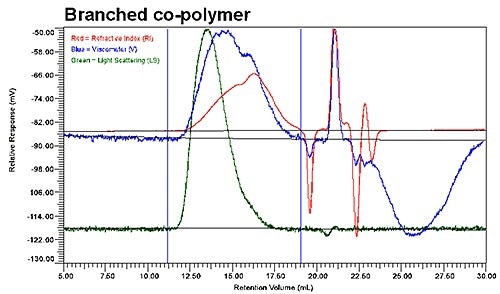
Figure 1. The raw detector signals for the RI detector (red), the RALS (green) and the viscometer-DP (blue); a) for the linear co-polymer and b) for the branched copolymer.
Table 1. Results from OmniSEC software.
| Sample ID |
Mn (Da) |
Mw (Da) |
Mw/Mn |
[η] (dL/g) |
dñ/dC (cm3/g) |
RH (nm) |
| Linear |
4838 |
14488 |
2.99 |
0.0927 |
0.083 |
2.60 |
| Low-brch |
5158 |
87918 |
17.0 |
0.1080 |
0.083 |
4.47 |
| Mid-brch |
4168 |
84264 |
20.2 |
0.0953 |
0.092 |
4.07 |
| High-brch |
6159 |
79075 |
12.8 |
0.0946 |
0.093 |
4.12 |
Table 1 references the molecular weight and polydispersity of the linear polymer is much smaller than that of the branched polymers. However, all four samples have similar intrinsic viscosity because the ratio between the size and the molecular weight is nearly constant for all samples. The known injection mass and the refractive index signal are used to calculate the dñ/dC values, providing information about the composition of the copolymers. The dñ/dC values of the low-brch and linear copolymers are identical. The dñ/dC value increases with the increment in the degree of branching, revealing the influence of the copolymer composition in favor of branching.
Polymer Branching
The degree of branching of a polymer can be measured only when the same polymer with a linear structure is available or its Mark-Houwink parameters (K and a) are known. In this case, the Mark-Houwink parameters were determined using the linear sample. The Mark-Houwink plots for the four samples are presented in Figure 2, showing a declining slope of the Mark-Houwink plot with increasing degree of branching.
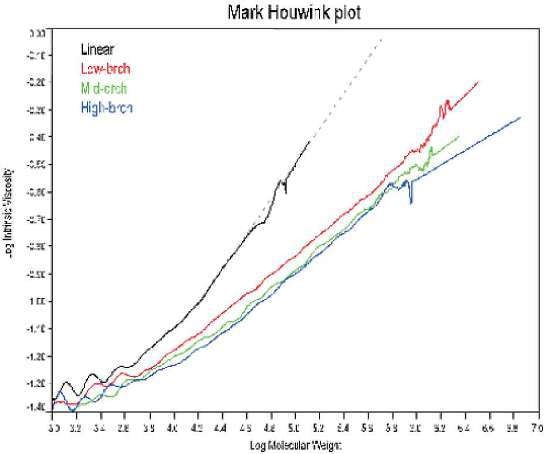
Figure 2. The Mark-Houwink plot for the linear (black), low branched (red), mid- branched (green) and high-brch co-polymers.
This trend is in line with the influence of dñ/dC on branching, revealing the impact of the composition on branching. When the molecular weight is constant, the size and intrinsic viscosity decrease with an increase in polymer branching. At first, the molecular weight dependence of the contraction factor g' is calculated to determine the branching parameters for polymer samples using the following equation:
g' = ([η]) branched/([η])linear
The molecular weight dependence of g' for the branched copolymers is plotted in Figure 3, showing high branching on the bottom and low branching on the top, with all converging to g' = 1 in the limit of low molecular weight. The convergence of medium and high branching g' results at higher molecular weights is due to the chemistry of formation of polymers, which have similar number of branches at higher molecular weight.
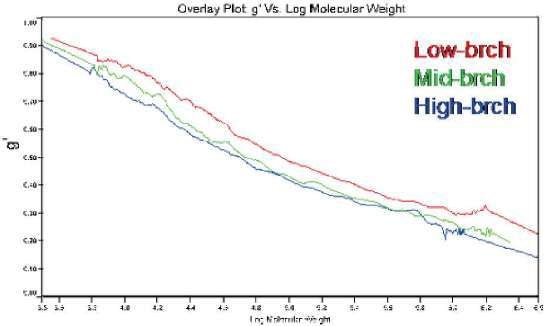
Figure 3. The values of g' versus molecular weight.
Secondly, the contraction factor g, a ratio of the square of the radius of gyration (Rg) of the branched polymer to that of the linear polymer, is determined to calculate the branching parameters for the samples. Rg is root mean square radius calculated from angle dependent static light scattering measurements. The following equation is used to calculate g from g' and the structure factor B:
g' = gB
The B value ranges from 0.5 for low branching polymer systems, 0.75 for medium branching, and up to 1.5 for high branching. The calculated g value is then applied to derive the branching number and frequency using the appropriate Zimm-Stockmayer expressions, which are a sequence of expressions based on polymer shape, number of arms per branching point, polydispersity.
The Zimm-Stockmayer equations relate the contraction factor g to the branching number. The copolymers studied were random, tri-functional, and polydisperse polymers. For this class of polymers, the following Zimm-Stockmayer expression is used:
The following equation is used to determine the branching frequency (λ):
Where, Mi = mass for each chromatographic slice; FR = repeat factor.
The molecular weight dependence of the branching frequency for the three copolymers is presented in Figure 4, clearly distinguishing the three polymer samples. The branching frequency is completely different for the mid and high branching polymers that are converging at higher molecular weights in the [η] and g' figures.
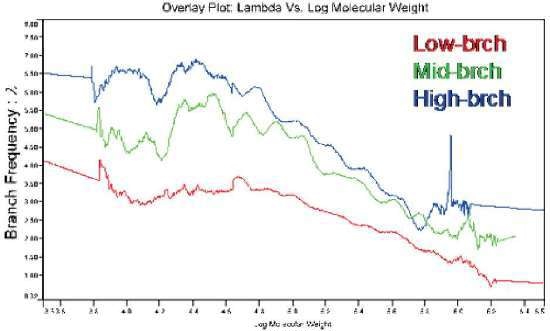
Figure 4. The branches versus molecular weight.
The branching calculations using the Viscotek OmniSEC software are summarized in Table 2. As expected, the low-brch has the lowest branching frequency of 2.68 and the high-brch has the highest close to five branching point per 100 repeat units.
Table 2. Results from the OmniSEC branching calculations.
| Sample ID |
Branches |
Branch Freq. |
| Linear |
0 |
0 |
| Low-brch |
17.8 |
2.68 |
| Mid-brch |
26.2 |
3.82 |
| High-brch |
29.2 |
4.99 |
Conclusion
The results clearly demonstrate the advantage of using advanced multi-detection GPC/SEC systems for the characterization of branched copolymers.

This information has been sourced, reviewed and adapted from materials provided by Malvern Panalytical.
For more information on this source, please visit Malvern Panalytical.