Botanical extracts are valued for the perceived benefit derived from their natural compounds. These extracts are major ingredients in personal care products and nutraceuticals. These industries are driven by consumers’ desire to adopt healthier lifestyles, and continue to flourish - by 2017 nutraceuticals alone is predicted to reach $204.9 billion. The beneficial claims often rely on certain compounds of the extract, placing a huge demand on ensuring the extracts’ identity and purity.
NMR spectroscopy can be used for these kinds of tasks, as this method is automatable and highly reproducible. Botanical extracts are complex mixtures that are prepared through extraction processes to improve the quantity of preferred components, thought to be responsible for the required benefits.
The quantity of vital components and lack of undesired materials (residuals solvents, adulterants, and unrelated botanical material) reflect the quality of botanical extracts. NMR spectroscopy can detect and measure components in plant extracts and other complex mixtures. It also offers a quick and highly reproducible way to verify purity, identity, composition, and strength of botanical extracts, providing quality control analysis and product assessment. It is possible to detect different types of compounds in the same spectrum.
1D 1H spectra typically need less than 10 minutes for data acquisition and analysis. This article discusses the procedure and the ability to automate the NMR analysis of goldenseal extract for use in botanical identity. Both identity and quantity of components are assessed for quality control.
Earlier, LC-UV methods were used to measure hydrastine, canadine, and berberine in goldenseal, but these methods failed to provide highly specific information about the compound. In contrast, NMR serves as a fully automated, information-rich, fast assessment tool that improves the confidence of a product’s composition.
Goldenseal: An Important Botanical
A native plant of eastern US and southeastern Canada, Goldenseal has been historically used in traditional medicine for its antibacterial, pharmacological, immunostimulant, anticancer, and antimicrobial properties. This plant is now considered one of the 20 most popular herbal supplements and is utilized across the globe. In the US, the goldenseal-echinacea combination is one of the 15 top-selling botanical dietary supplements, with 2008 sales totaling approximately 7 million US dollars.
The goldenseal’s pharmacological effects are largely attributed to alkaloids that are present in the plant canadine, hydrastine, and berberine. Due to the popularity and the slow growing nature of goldenseal, a number of other plants that contain berberine have replaced the plant. The adulterants include Oregon grape root, Yellow root, goldthread, and Barberry. Berberine is found in most of these adulterants, however canadine and hydrastine are known only from goldenseal.
Materials and Methods
Material identification
Between 2005 and 2006, Dr. John Arnason from Ottawa University had morphologically identified the goldenseal root.
Goldenseal Extraction
In May 2005, dried goldenseal roots were sourced from a Hamilton (Ontario, Canada) goldenseal farm and subsequently milled to a powder with a particle size of less than 250 µm, homogenized with a rotary mixing drum, and finally stored at -80°C. Using ultrasonic bath, about 200 mg of the material samples were extracted at 35°C for a period of 20 minutes.
Extract Optimization
A range of solvent systems were assessed for the highest recoveries of the three key alkaloids (Figure 1) in goldenseal root powder. The highest recoveries of the key alkaloids were found to be more than 97%, with a 90% methanol/water/0.1% formic acid (v/v/v) solvent system. The material was sonicated for a period of 20 minutes and extracted 6 times.
After combining the extract solutions, they were then filtered. The supernatant liquid obtained was dried with a speed-vac at room temperature, and NMR of this dry extract of goldenseal root powder was utilized to detect and quantify major metabolites, which are believed to exist in goldenseal, including hydrastine, canadine, and berberine. As reference standards for berberine, canadine and hydrastine, NRC certificate reference material were utilized under the respective names of Berb-1; Cana-1 and Hydras-1.
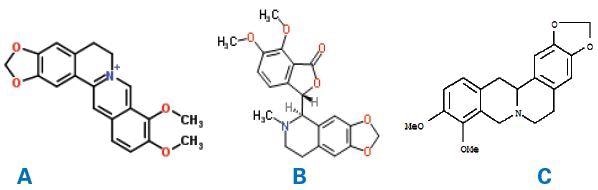
Figure 1. Molecular structures of berberine(A), hydrastine(B) and canadine (C).
NMR Conditions
The samples were dissolved in 600 ul DMSO-d6, vortexed for 1 minute, sonicated for 5 minutes, vortexed again for 1 minute, and finally centrifuged at 13,200 rpm. The supernatent liquid was transferred to a 5 mm NMR tube. Material weights for the extract, hydrastine, berberine, and canadine were 16.4 mg, 12.3 mg, 11.5 mg, and 10.8 mg, respectively. At 400 and 600 MHz, NMR spectra were recorded on Bruker Avance III spectrometer through the 1H noesyigld1d pulse sequence. Spectra were obtained in 8 minutes for each sample (32 scans), and NMR analysis was performed in automation using Bruker’s AssureRMS 1.5 pl2 software package. This package uses the PULCON equation and an external quantification standard for absolute quantification results.
Generation of an NMR Spectra Database
A spectral database (SBASE) was developed using the 1H NMR spectra of certified reference material for hydrastine, canadine, and berberine. This SBASE served as a chemical shift reference library for automated detection of major metabolites of goldenseal. Using the Assure-RMS procedure, SBASE entries were generated by eliminating solvent, noise, and impurity peaks, as well as wide exchangeable signals from the 1H NMR spectrum (Figure 2).
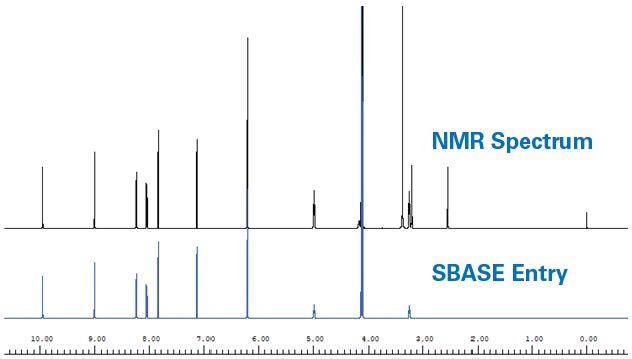
Figure 2. Example of generation of a spectral database (SBASE) entry. 1H NMR spectrum of berberine (top) and resulting SBASE entry (bottom) after DSS, DMSO- D6, H2O, broad exchangeable signals and noise were removed.
The resulting SBASE entry for individual compounds contained coupling, peak shape, peak position, and peak intensity data. The hydrastine, berberine, DSS (NMR reference standard) and DMSO (solvent) SBASE entries, compared to the goldenseal extract are shown in Figure 3.
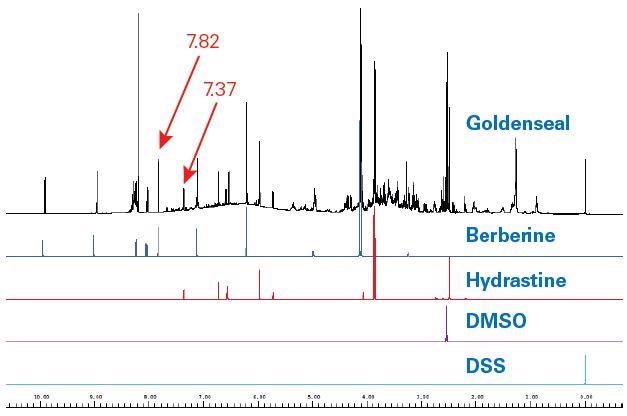
Figure 3. 400 MHz Goldenseal 1H NMR spectrum (black) as compared to SBASE entries for berberine (blue), hydrastine (red), DMSO (violet) and DSS (turquoise). The signal to- noise of berberine in the goldenseal spectrum for the signal at 7.82 ppm (single proton) at 400 MHz was 547. For hydrastine the S/N was 173 for the proton at 7.37 ppm (single proton).
Two target compounds – hydrastine and berberine – can be instantly detected in the extract spectrum when comparing coupling, intensity, and peak shift. Comparison was made between the goldenseal and the canadine SBASE entry, which was also detected (Figure 4).
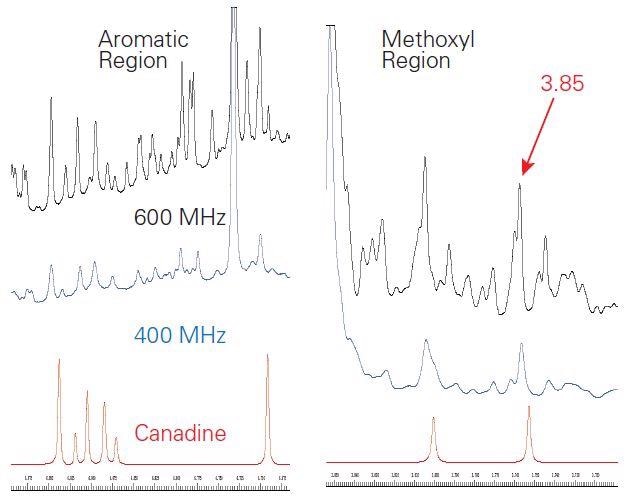
Figure 4. Expansions of the aromatic (left) and methoxyl (right) regions of the 1H NMR spectra of goldenseal at 600 MHz (black) and 400 MHz (blue) as compared to the SBASE entry for canadine (red). The signal-to-noise of the methoxyl signal (3 equivalent protons) at 3.85 ppm was 494 at 400 MHz and 891 at 600 MHz. Slight shifts in peak positions were observed.
Detection and Quantification of Key Components
The signal-to-noise (S/N) of the three major components was considered from the crude extract spectrum to find out the empirical conditions for automated analysis of goldenseal. At 400 MHz, an 8 minute (32 scans) experiment offered sufficient S/N with regard to canadine, which happens to be the lowest concentration of component of the three considered (Figure 4). The S/N, determined from the separated methoxyl signal at 3.85 ppm, was 494 and 891 at 400 MHz and 600 MHz, respectively. Detection of lower concentrated components at 400 MHz would need an extended experiment time. Given that the S/N increases by the square root of two for NMR, the number of scans required can be measured according to the expected concentration of components.
Assure-RMS procedure was used to establish the automated analysis method (Figure 5). SBASE components were automatically imported by choosing all the components from the SBASE entry (Figure 5A). A search list was eventually populated, where the type of component was entered. In addition, maximum and minimum concentrations can be set in case the material is preferred to comply with certain product specifications. This table, as well as the SBASE data, was used by the program to populate the search regions in the NMR spectrum for automatic assessment. The peaks for quantification were then evaluated for ability to measure the peak, depending on other overlapping or nearby signals. Subsequently, the Assure-RMS method was saved and utilized for automated analysis and reporting of extract of goldenseal.
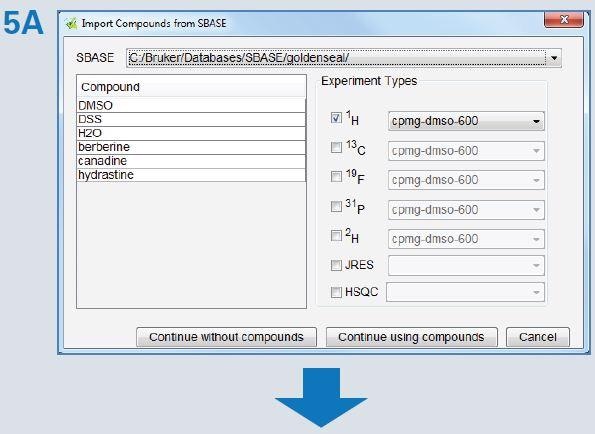
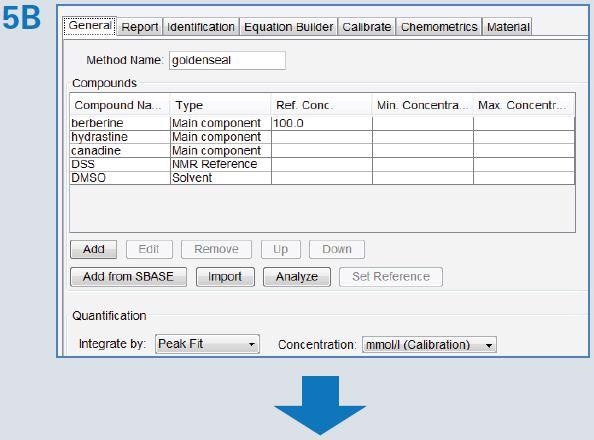
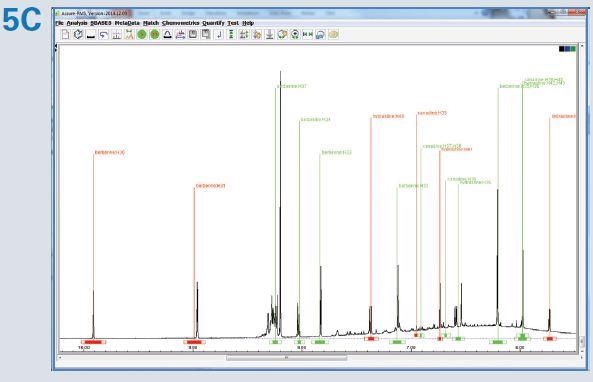
Figure 5. The Assure-RMS procedure used for generation of the goldenseal automated analysis method included: (A) importation of components from the SBASE, (B) assignment of the component type (main component, solvent, NMR reference, possible adulterant, etc.), allowable minimum and maximum concentrations and quantification reporting criteria (mmol/L), and (C) identification of peaks selected for quantification (red) that are typically well resolved or easily identifiable signals.
Results
Automated analysis of goldenseal extract helped to detect the presence of the three major components and the quantification results were subsequently reported, as illustrated in Table 1.
Table 1. Automated quantification results of components in goldenseal extract sample for data acquired at 400 MHz. Entry used for Identity Match only. The concentration for DSS and DMSO was not determined
| Comopound |
Category |
Concentration(mg/g) |
Std Dev |
| Berberine |
Main Component |
75.77 |
1.90 |
| Hydrastine |
Main Component |
54.14 |
0.82 |
| Canadine |
Main Component |
7.07 |
5.17 |
| DSS |
NMR Reference |
NA |
NA |
| DMSO |
Solvent |
NA |
NA |
Among the three key components, berberine was present in the highest quantity, and this was followed by hydrastine and canadine with values of 75.8 mg/g, 54.1 mg/g and 7.1 mg/g, respectively. The results obtained were found to be consistent with the physical analysis of the goldenseal extract spectrum.
Conclusion
Nuclear Magnetic Resonance (NMR) can precisely detect the presence and quantity of canadine, hydrastine, and berberine from the crude sample extract of goldenseal root powder, without any need for additional purification and separation processes. For the automated analysis, an NMR spectral database was produced and used, and the same can be extended to search for more components in goldenseal. This automated process provides an effective way to detect the components of extracts, but can also be applied to other complex mixtures where component verification is required for evaluation and quality control of products.

This information has been sourced, reviewed and adapted from materials provided by Bruker BioSpin - NMR, EPR and Imaging.
For more information on this source, please visit Bruker BioSpin - NMR, EPR and Imaging.