For therapeutic biomolecules stability is a key quality attribute that is important for establishing drug-like properties and applicability for use in humans. However, it is both time-intensive and laborious to establish the stability of a candidate molecule or formulation.
Developers of biologics are in search of high-throughput screening techniques that can test and rank different combinations of candidates, buffer conditions, and excipients to reduce time, effort and the cost associated with long-term stability studies.
Experimental methods utilized in these screens need to identify various stability-indicating parameters (SIPs) as no single parameter has yet shown to be the silver bullet indicative of long-term shelf life or stability when exposed to a range of environmental stresses, such as freeze-thaw or elevated temperatures.
Short-term aggregation, thermal stability, and colloidal stability are some of the most useful SIPs to date. Short-term aggregation represents the formation of small aggregates, and thermal stability is the propensity of a protein to aggregate and/or unfold with temperature, generally because of exposure of the hydrophobic core.
Colloidal stability is the propensity of molecules to associate because of weak, attractive forces associated with hydrophobic surface residues, surface charges, and similar moieties. These SIPs are not completely independent of each other.
For instance, colloidal stability is generally related to the reversible association, but the enhanced proximity under self-attractive conditions is capable of promoting irreversible aggregation rates. However, increased surface charge may enhance colloidal stability and reduce colloidal attraction, but degrade thermal stability because the tertiary structure of the protein is destabilized by the charges.
Various methods have been used to evaluate SIPS, such as static light scattering, infrared or Raman spectroscopy, circular dichroism, intrinsic and extrinsic fluorescence, and differential scanning calorimetry. However, dynamic light scattering (DLS) is a versatile technique due to its ability to provide quantitative insight into a wide range of phenomena associated with stability.
It can concurrently quantify aggregation and distribution of aggregate sizes and thermal stability by differentiating between pure unfolding and aggregation via a temperature transition. Colloidal stability can be measured through the concentration dependence of diffusion. The changes in specific volume and average molar mass can be determined by analyzing the same data.
A biomolecule's stability is not an entirely intrinsic property, as it is influenced by the concentration at which the protein is formulated and buffer composition. Protein stability must be measured as a function of specific ion type, ionic strength, pH, and excipient profile for an optimal and successful formulation.
Luckily, DLS is compatible with the high-throughput, low-volume screening of hundreds of conditions per hour with the help of a plate reader, using industry-standard microwell plates. Wyatt Technology’s DynaPro Plate Reader can perform high-throughput screening with dynamic light scattering (HTS-DLS).
It contains 96, 384 or 1536-well plates and performs temperature scans of all samples simultaneously for a temperature range of 4 - 85°C. It is possible to extend the multiplexed approach offered by HTS-DLS to a variety of other formulation conditions to rapidly characterize protein behavior.
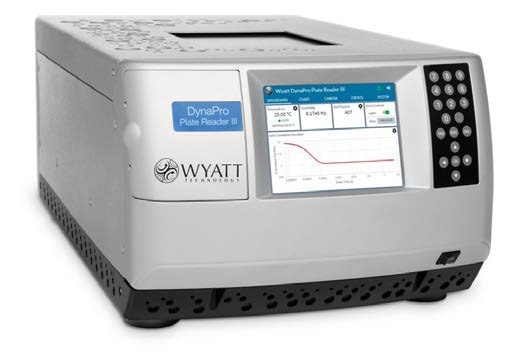
Figure 1. The DynaPro Plate Reader enables high-throughput DLS studies of aggregation and stability-indicating parameters, in-creasing productivity in formulation studies.
The simultaneous measurement of thermal and colloidal stability provides qualitatively unique data: the direct interaction between colloidal and thermal stability mechanisms, indicated by the temperature dependence of the colloidal interaction parameter within the vicinity of a thermal transition.
This article discusses HTS-DLS measurements, which reveal the effect of thermally-induced protein unfolding on colloidal interactions and provide a quantitative metric to rapidly rank protein formulations.
The Interaction Parameter
Fluctuations in scattering intensity can be directly measured by DLS due to Brownian motion and are studied to measure the translational diffusion coefficient Dt and an effective measure of the molecular size, the hydrodynamic radius Rh.
A rough measure of size distributions can also be obtained by DLS to evaluate populations of monomers and aggregates. Though not as powerful as a separation method, such as size exclusion chromatography coupled to light scattering detectors (SEC-MALS), DLS is often good enough for screening purposes and will even reveal the presence of size populations that vary by 3-5x in radius.
Dt is a function of concentration (c) because of non-specific protein-protein interactions arising largely from charged and hydrophobic residues. Analysis of Dt vs. c results in the first-order diffusion interaction parameter kD as shown in the following equation.
D=D0 (1+ kDc+ ...)
Positive values for kD represent repulsive intermolecular interactions, and negative values represent attraction. There is a direct relationship between the diffusion interaction parameter and the second virial coefficient A2, a commonly accepted thermodynamic measure of colloidal stability and tendency for aggregation.
Measuring A2 with low volume and high throughput is generally very difficult and kD acts as a convenient proxy. Therefore, it is possible to use kD for rapid comparison of different protein formulations and the selection or engineering of more stable biomolecules.
Materials and Methods
A DynaPro Plate Reader carried out HTS-DLS measurements for concurrent thermal, colloidal, and mixed stability analysis, also evaluating the degree and size distribution of aggregation. The ability to measure the sample completely in situ in the well is a key advantage of this instrument.
This capability eliminates carry-over issues common to microfluidic platforms, while improving throughput. The stock solution was prepared by dissolving a monoclonal antibody (MAb1) in 50 mM bis-tris-propane buffer (BTP) at pH values of 6.5, 7.5, 8.5 and 9.5 to a final concentration of 15 mg/mL.
The next step was to filter the stock solution to 0.1 µm and diluting and arraying it in a 384-well microtiter plate (Aurora) at five replicates of six different protein concentrations from 0.47 to 15 mg/mL, for each of the four pH values. Each well was loaded with 20 µL of solution.
The plate was then subjected to centrifugation for 1 minute at 400 g, and then 1-2 drops of paraffin oil were used to cap each well to prevent evaporation. The plate was centrifuged for a second time at 400 g for 1 minute before the measurements were performed.
Initial measurements were performed at 25°C using control samples of bovine serum albumin and lysozyme in the same plate. An extended sequence of measurements were then carried out as a function of temperature, progressively increasing from 25°C to 85°C at a rate of 0.1°C/min.
The MAb1 solutions were sequentially measured during the ramp, completing five 2-second acquisitions at each concentration and pH for three replicate wells, every 0.5°C. DYNAMICS software from Wyatt Technology and Microsoft Excel were used to perform the instrument control, data acquisition, and analysis.
Autocorrelation analysis was performed to determine Dt and Rh and kD was derived from the linear regression of Dt vs. c. The plot of Rh vs. temperature was fit to an appropriate model to determine aggregation onset temperature Tonset.
Results and Discussion
Interaction Parameter as a Function of pH
The MAb1 antibody showed decreasing Dt (or increasing Rh as a function of concentration (Figure 2)), which matched a negative kD and the corresponding protein-protein attraction. This MAb1 shows kD < 0 for all pH values tested (Figure 3), suggesting a tendency to assemble into oligomeric species.
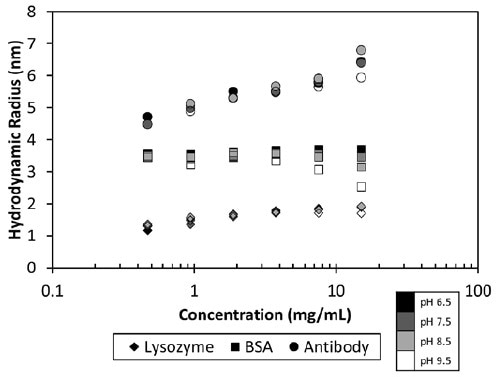
Figure 2. Measured hydrodynamic radius as a function of concentration and pH for three proteins.
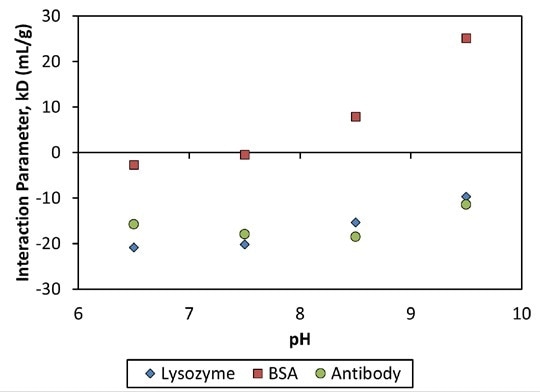
Figure 3. Interaction parameter, kD, as a function of pH for three proteins.
Thermally-Induced Aggregation
Beyond the thermal transition around 55°C, the MAb1 antibody quickly aggregates into large complexes at pH 8.5, with Rh at 75°C spanning between 80 and 800 nm (Figure 4). Tonset reduces with concentration, spanning from 55.0 to 56.8°C (Figure 4, inset).
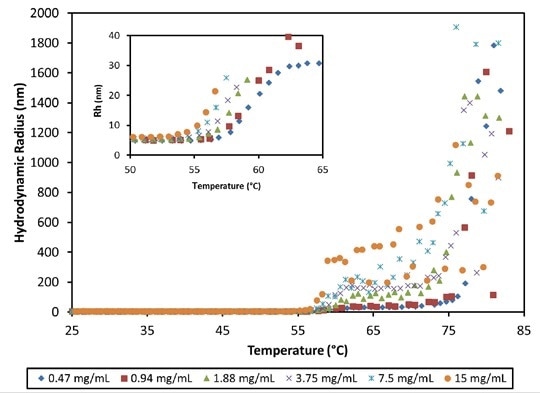
Figure 4. Hydrodynamic radius as a function of temperature and concentration for an antibody formulation at pH 8.5. High order aggregate formation is evident for temperatures >56°C.
The final state of aggregation largely depends on the concentration, differing by more than two orders of magnitude in the average size of particles between the highest and lowest concentrations. At 70 - 75°C, a second transition takes place, possibly associated with the unfolding of another IgG domain.
This leads to a large-scale aggregation into particles measuring greater than 1 µm.This high level of aggregation indicates that the observed concentration reliance beyond the thermal transition is mainly due to higher molecular collision rates.
This can be validated by changing the ramp rate of temperature. However, at pH 9.5, the MAb1 antibody shows a change from Rh = ~4.8 nm, a characteristic of IgG, to a steady value from 15 to 22 nm, based on concentration, for temperatures over 62°C (Figure 5).
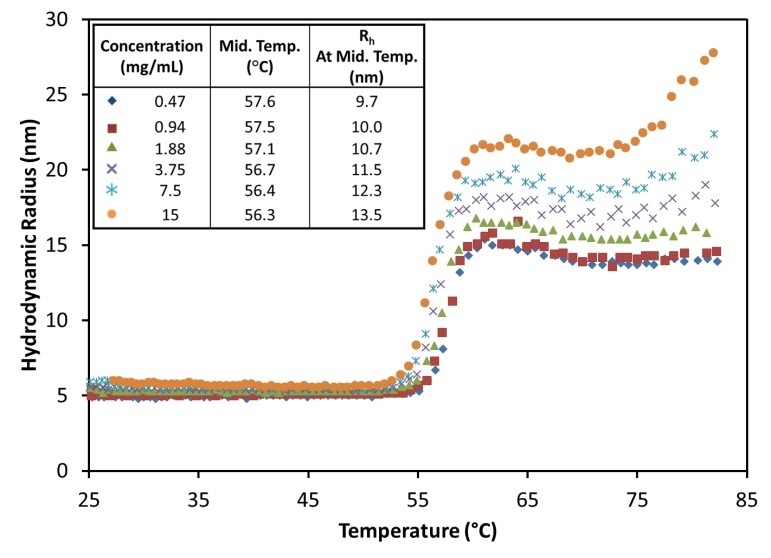
Figure 5. The hydrodynamic radius exhibits a sigmoid relationship as a function of temperature for all antibody concentrations at pH 9.5, showing little change in the midpoint with concentration.
Reversible oligomerization is indicated by the stability and tiny size of the aggregates at this pH, and the same can be validated by changing the ramp rate or reversing the temperature ramp, or a combination of both. At about 75°C, the antibody emerges to enter a secondary unfolding transition, similar to pH 8.5 although with a relatively smaller scale of aggregation and with no major impact at lower concentrations.
Qualitative variation, observed in the aggregation processes under two conditions, is additionally explained in the size distributions acquired with DLS regularization analysis. At a temperature of 80°C and with a concentration of 1.88 mg/mL, the pH 8.5 sample shows a bimodal distribution with populations of 30 to 100 nm and 300 to 3000 nm, whereas the pH 9.5 sample at the same level of concentration shows just one distribution at 80 to 300 nm (Figure 6).
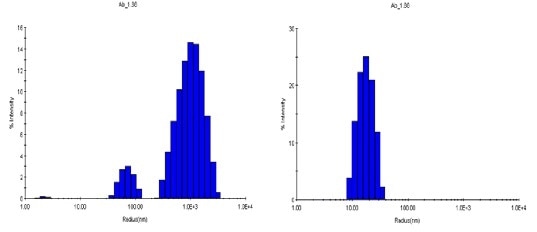
Figure 6. Size distributions obtained at 80°C via regularization. Left: pH 8.5; right: pH 9.5.
Interaction Parameter Through the Thermal Transition
kD is negative below the thermal transition and is roughly constant with increased temperature for both set of pH values. At pH 8.5, the degree of kD is two times that of pH 9.5, suggesting a stronger intermolecular attraction, which corresponds with the extremely different aggregation behavior.
kD shows a clear transition behavior against the pH, close to the folding-unfolding transition and towards the beginning of aggregation.
kD experiences a major step-change from 53°C to 59°C, at pH 8.5 (Figure 7 and inset). Interestingly, the change starts several degrees before the occurrence of any substantial aggregation, indicating increased protein-protein attraction as a result of pure unfolding.
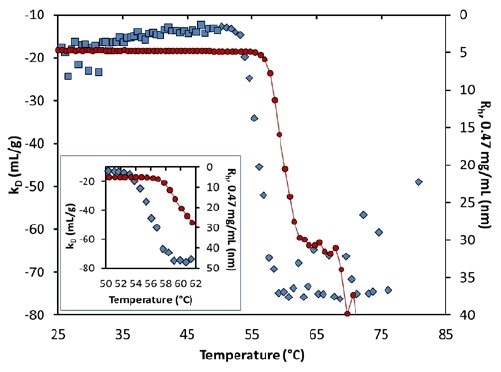
Figure 7. Diffusion interaction parameter (symbols, left axis) and radius (solid line, right inverted axis) at lowest concentration as a function of temperature at pH 8.5. Inset: same, highlighting the transition region.
kD is constant beyond 59°C, although it is noisy due to the numerical complexity of assigning an average radius when there is bimodal population. The extent of aggregation is based on concentration, as seen in Figure 4.
However, this seems to point to higher collision rates. Therefore, the quantified value of kD further than ~56°C could suggest the kinetics and history of the aggregation process and not the actual thermodynamic interaction.
At pH 9.5, an analogous change in kD indicates the unfolding transition: Before aggregation, kD becomes more attractive (or negative), but rather than a step-change, a local minimum takes place just as the quantified hydrodynamic radius starts to indicate aggregation (Figure 8).
The extent of kD reduces to become less negative after this aggregation. This change in kD suggests that attractive interactions increase during the initial unfolding transition, as the hydrophobic core is exposed.
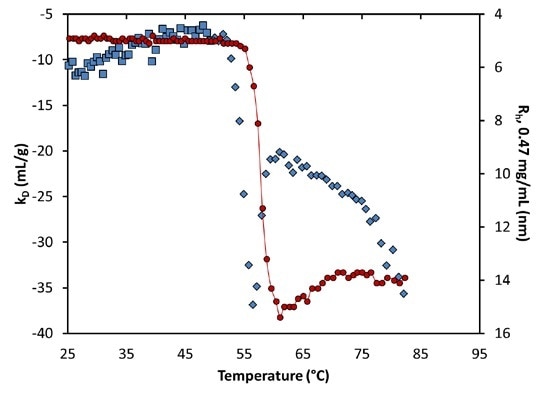
Figure 8. Diffusion interaction parameter (symbols, left axis) and radius (solid line, right inverted axis) at lowest concentration as a function of temperature at pH 9.5. Inset: same, highlighting the transition region.
Conversely, as soon as a stable structure has been obtained in such conditions, the interactions are partly reduced, because the exposed regions are concealed from the solution. At around 75°C, a secondary unfolding transition is distinctly seen in kD.
Conclusion
By screening protein formulations at early development stages, researchers can focus on the most viable candidates, and save a considerable amount of time and effort, sample, and testing apparatus. This study shows how the DynaPro Plate Reader is used to simultaneously determine the proteins’ colloidal and thermal stability and the true aggregation states during the screening procedure, to rank the effectiveness of formulation conditions and candidate molecules.
Colloidal stability and thermal stability are measured as kD and Tonset, respectively. The temperature reliance of kD provides an improved understanding of the effect of the unfolding process on colloidal interactions, as this process shows moieties that were earlier concealed from proteins and buffer.
DLS could suggest chemical stability; the specific volume and average molar mass of molecules in solution as a function of temperature; and solution viscosity, which is another major aspect in the development of biotherapeutics of high concentration.
HTS-DLS offers a great deal of data for quick screening of buffer conditions, candidate molecules, and excipients towards higher productivity.

This information has been sourced, reviewed and adapted from materials provided by Wyatt Technology.
For more information on this source, please visit Wyatt Technology.