Glucomannans are branched polysaccharides of glucose and mannose. They are found in several plants as energy reserve. High amounts of glucomannans are found in the Konjac root (Amorphophallus konjac).
Nutritional benefits such as cholesterol lowering were found in the flour from the Konjac root. As it has the ability to stimulate gut-friendly bacteria, it is referred to as a prebiotic1. A prebiotic is a selectively fermented ingredient that enables particular changes, both in the activity and/or composition in the gastrointestinal microflora that confers benefits upon host wellness and health2.
Prebiotics are a specific class of functional food. Oligosaccharides have the benefit that they can endure the whole gastrointestinal transit and reach gastrointestinal bacteria3. Partial hydrolysis of glucomannans produces glucomannooligosaccharides which have displayed a better prebiotic function compared to pure glucomannan.
Glucomannooligosaccharides’ prebiotic effect with a degree of polymerization (DP) of 5 was better than for those with a DP of 104. Therefore, partial enzymatic hydrolysis is of great interest5. Liquid chromatography is one option to test samples following lysis and to approximate the degree of polymerization and composition.
The new AZURA RID 2.1L was tested for its limit of quantification (LOQ). The KNAUER Eurokat Na+ column was also tested for its ability to divide saccharides with a degree of polymerization greater than 2. A mixture of mannooligosaccharides and mannose was used as a test substrate, as these oligosaccharides can be utilized as reference for the products of the hydrolysis.
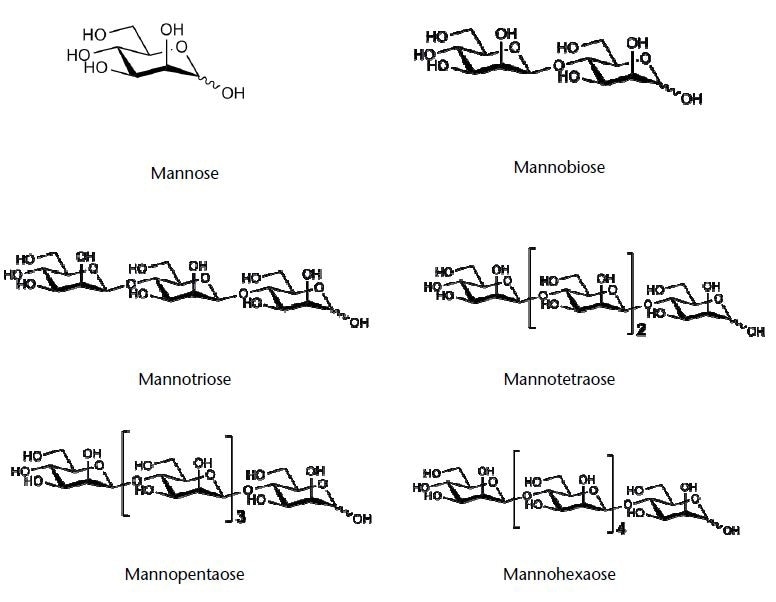
Figure 1. Chemical structures of the tested saccharides (structures kindly provided by company Megazyme)
Experiment
Sample Preparation
Standard solutions of 12 mg/ml of the six saccharides were prepared in H2Odd. A mixture of all six saccharides, each with a concentration of 2 mg/ml was prepared and passed via a 45 µm filter. From this standard mixture, eight 1:2 dilution steps were made for the calibration points.
Final concentrations were: 2 mg/ml; 1 mg/ml; 0.5 mg/ml; 0.25 mg/ml; 0.125 mg/ml; 0.0625 mg/ml; 0.03125 mg/ml; 0.015625 mg/ml; 0.0078125 mg/ml. The saccharides were purchased from Megazyme.
Method Parameters
| |
|
| Column: |
Eurokat Na+, 300 x 8 mm, 10 µm |
| Eluent A: |
H2Odd |
| Flow rate: |
0.5 ml/min |
| Injection volume: |
10 µl |
| Column temperature: |
75°C |
| System pressure: |
50 bar |
| Detection: |
RI |
| Run time: |
16 minutes |
The LOQ of the new KNAUER AZURA RID 2.1L was measured and compared with the KNAUER Smartline S2300 RI detector. An analytical KNAUER Eurokat Na+ column was used to separate a mixture of saccharides, which were was used as a test substrate.
A series of dilutions beginning from 2 mg/ml to 0.0078125 mg/ml were prepared, and calibration curves were measured for each saccharide of the mixture.
Results
Figure 2 shows a mixture of mannose, mannotriose, mannobiose, mannopentaose, mannotetraose, and mannohexaose that were separated using the Eurokat Na+ column. Mannose, mannotriose and mannobiose were baseline divided. Mannotetraose was nearly baseline separated, while the peaks for mannohexaose and mannopentaose were not baseline separated (Figure 2).
Using the Smartline RI detector S2300, the chromatogram of this mixture displayed a similar separation (data not shown).
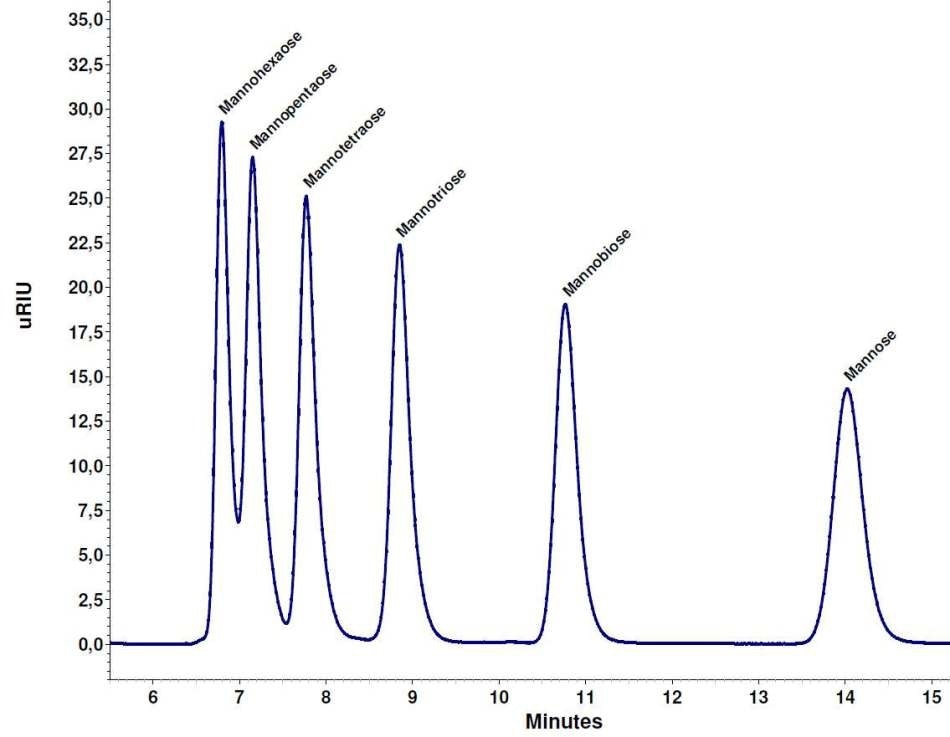
Figure 2. Separation of the saccharide mixture, each 2 mg/ml, Eurokat Na+ 300 x 8 mm.
The LOQ for the six tested saccharides was determined and compared using the Smartline RI detector S2300 and the AZURA RID 2.1L. The noise was determined and the LOQ calculated based on the peak height using the calibration graphs shown in Figure 3.
The LOQs for all tested saccharides determined with the AZUAR RID 2.1L were considerably lower than those detected with the Smartline RI detector S2300 (Figure 4).
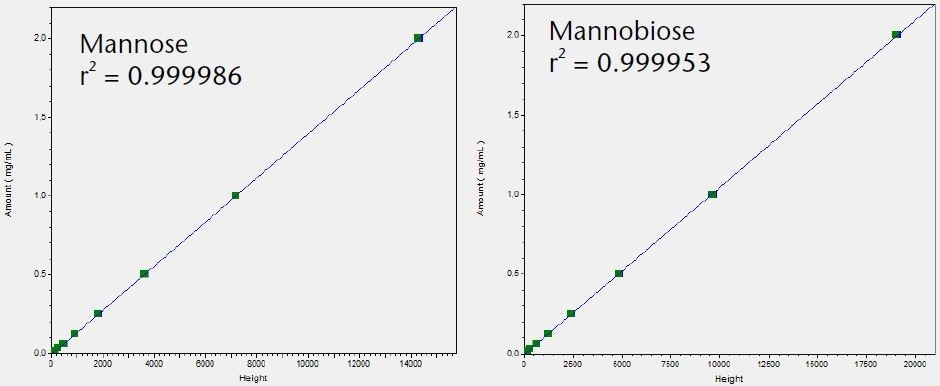
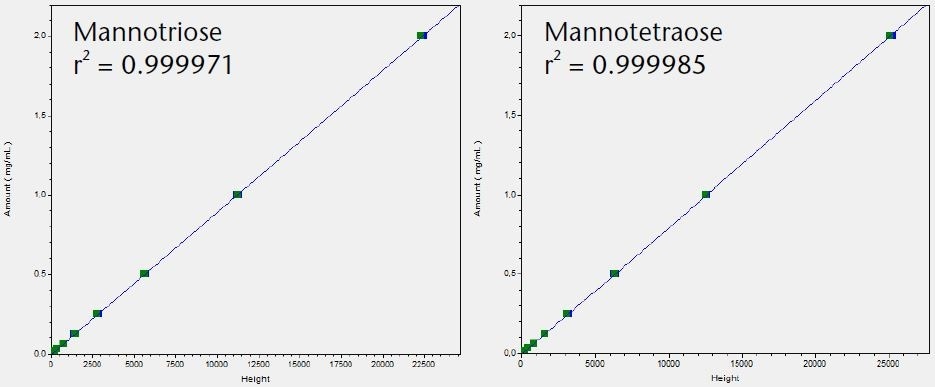
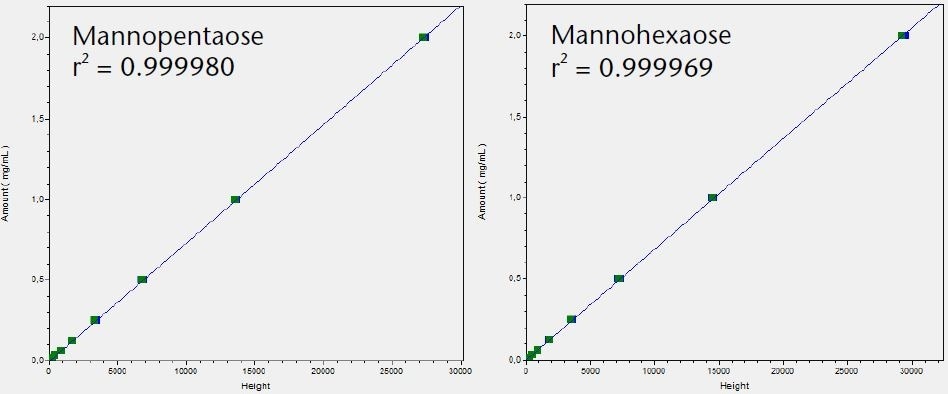
Figure 3. Calibration graphs for all six tested saccharides with indication of linearity r2
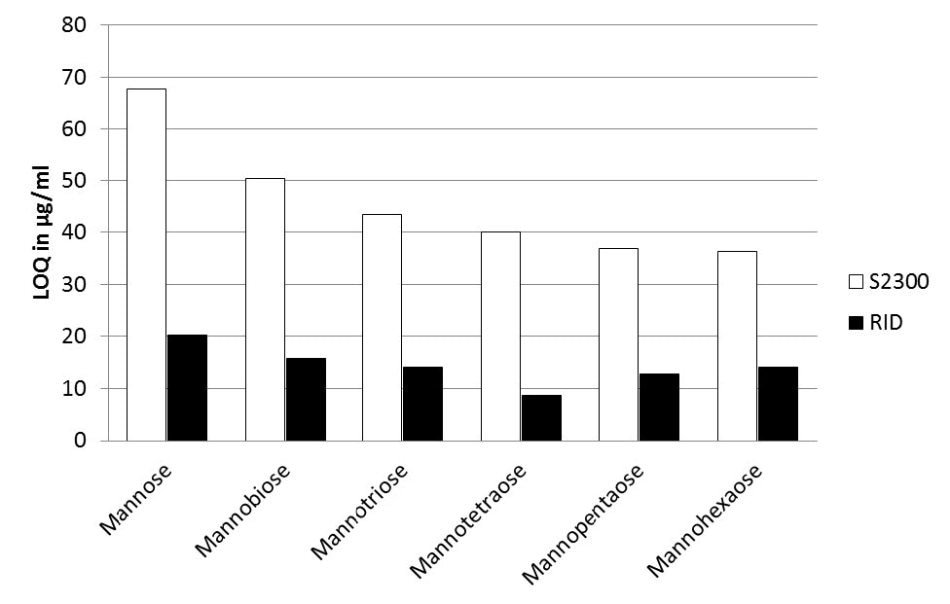
Figure 4. Comparison of AZURA RID 2.1L (black bars) and Smartline RI detector S2300 (white bars) for their LOQ values for the six tested saccharides
The LOQ range for the Smartline RI detector S2300 was between 65 µg/ml and 35 µg/ml, compared to the LOQ range for the new AZURA RID 2.1L which was between 20 µg/ml and 8 µm/ml.
The LOQ of the AZURA RID 2.1L was determined to be 20% to 38% lower than the LOQ of the Smartline RI detector S2300, which is a considerably higher sensitivity (Figure 5).
Table 1 shows the total LOQ values of all measured saccharides. The relative standard deviation (RSD) values were measured for the peak height of four replicates at 15.6 µg/ml of each saccharide. The % RSD values calculated for the tested saccharides measured with the RID 2.1L were between 0.52% and 3.33% and for the Smartline S2300 between 2.52% and 7.61%.
These results emphasize the more accurate measurement at low sample concentration, and increased sensitivity of the AZURA RID 2.1L.
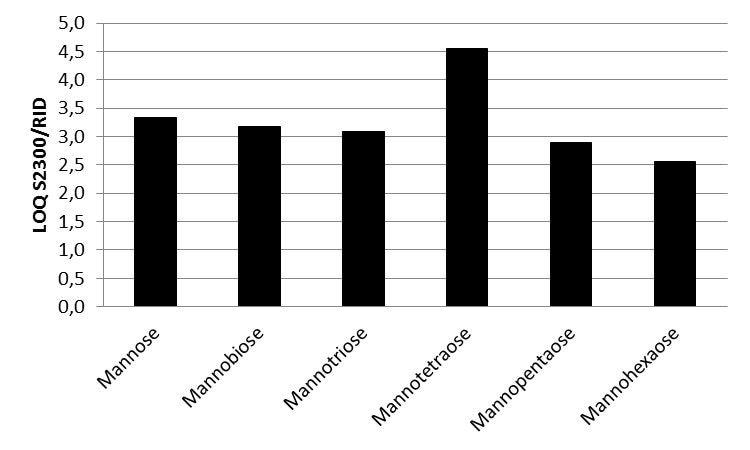
Figure 5. LOQ ratio of Smartline RI detector S2300 and AZURA RID 2.1L values for all six saccharides
Table 1. Comparison of total calculated LOQs and %RSD (peak height) of 1:128 dilution step (15.6 µg/ml) of all saccharides measured with AZURA RID 2.1Land Smartline RI S2300
| Saccharide |
RID 2.1L |
S2300 |
| LOQ in µg/ml |
%RSD (height) for 15.6 µg/ml |
LOQ in µg/ml |
%RSD (height) for 15.6 µg/ml |
| Mannose |
20.35 |
1.67 |
67.72 |
6.74 |
| Mannobiose |
15.82 |
3.33 |
50.39 |
7.61 |
| Mannotriose |
14.09 |
2.11 |
43.49 |
6.38 |
| Mannotetraose |
8.77 |
0.58 |
40.02 |
5.30 |
| Mannopentaose |
12.79 |
1.07 |
36.93 |
5.66 |
| Mannohexaose |
14.15 |
0.52 |
36.29 |
2.52 |
Conclusion
A KNAUER Eurokat Na+ column was used to separate a mixture of six saccharides. Mannose, mannotriose, mannobiose, and mannotetraose were baseline seperated. The new KNAUER AZURA RID 2.1L was used for detection and had an LOQ based on the saccharide between 10 and 20 µg/ml. The AZURA RID 2.1L is up to 4.5 times more sensitive than the Smartline RI detector S2300.
The AZURA RID 2.1L combined with the Eurokat Na+ column is an exceptional tool for the separation and identification of oligosaccharides with a degree of polymerization ranging between 2 and 5. Concentrations can be tested for specific saccharides down to 10 µg/ml.
Eurokat Na+ is applicable for the division of sugar oligomers.
See the White Paper for More Information
Physical Properties of Recommended Column
| |
|
| Stationary phase |
Sulfonated cross-linked styrene-divinylbenzene co-polymer in sodium form |
| Particle size |
10 µm |
| Form |
spherical |
| Cross linkage % |
6 |
| Dimensions |
300 x 8 mm |
| Order number |
30GX210EKN |
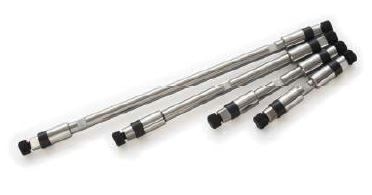
Recommended Instrumentation
The analysis of saccharides requires an isocratic HPLC system fitted with autosampler, column oven, degasser, and a refractive index detector. Other configurations can also be provided.
| Description |
Order No. |
| AZURA P 6.1L Quaternary HPLC pump, stainless steel 10 ml |
APH34EA |
| AZURA RID 2.1L |
ADD31 |
| AZURA CT2.1 Column Thermostat |
A05852 |
| Autosampler 3950 |
A50070 |
| AZURA Eluent Tray E 2.1L |
AZC00 |
| OpenLab CDS EZChrom Edition |
A2600-1 |
See the White Paper for More Information
References
1. Al-Ghazzewi F. H., Khanna S., Tester R.F., Piggot j. The potential use of hydrolysed konjac glucomannan as a prebiotic. J Sci Food Agric 87:1758-1766 (2007)
2. Roberfroid MB. Prebiotics: The Concept Revisited. J Nutr. 137 (3 Suppl 2): 830S–7S. PMID 17311983 (March 2007)
3. Albrecht S., et al Enzymatic production and characterization of Konjac glucomannan oligosaccharides J. Agric. Food Chem. 59: 12658-12666 (2011)
4. Chen J., Liu D., Shi B., Wang H., Cheng Y., Zhang W. Optimization of hydrolysis conditions for the production of glucomanno-oligosaccharides from konjac using ß-mannase by response surface methodology Carbohydrate Polymers 93: 81-88 (2013)
5. van Zyl W. H. Rose S. H., Trollope K., Görgens J. F. Fungal ß-mannanases: Mannan hydrolysis, heterologous production and biotechnological applications Process Biochemistry 45: 1203-1213 (2010)

This information has been sourced, reviewed and adapted from materials provided by KNAUER Wissenschaftliche Geräte GmbH.
For more information on this source, please visit KNAUER Wissenschaftliche Geräte GmbH.