UHP-SEC has become the preferred technique for analysis of synthetic polymers. Significantly reduced consumption of sample/solvent as well as run times provides considerable time- and cost-saving benefits. Considering the better resolution in separation and the consequential enhancement in quantification of oligomers and monomers, plus the flexibility to return to standard GPC as required, the case for moving to a highly-productive UHP-SEC system is clear.
Pitfalls of Analytical UHP-SEC
Despite the clear advantages of UHP-SEC, a number of drawbacks need to be tackled. The first drawback is the implicit assumption of a column calibration curve: that different elution times essentially imply different molar masses, with decreasing molar mass corresponding to increasing elution time. Considering this logic, a narrow standard would elute in a very narrow peak, actually narrower than the inherent broadening because of the finite column volume. In fact, even a narrow standard elutes with a width that — hypothetically, by column calibration — corresponds to a minimum of a two- to four-fold span in molar mass.
Surface chemistry is the second drawback: when improving a separation method, conditions should be found wherein sample to be tested and the reference markers interact ideally (e.g. through charge or hydrophobic interactions) with the column packing. This is because column calibration relies on the assumption that the sample and reference molecules experience only ideal (steric) interaction with the column, and any extra ‘stickiness’ will lead to inaccurate results.
In comparison to HPLC-SEC columns, relatively few surface chemistries are available to UHP-SEC for method optimization and so there is a higher probability that the method will not be completely optimized. The third drawback is column drift and creep in chromatography conditions: with such a rapid separation, even a slight variation in elution time due to sample loading, column aging, or changes to the pump operation conditions will result in a relatively large error in the estimated molecular weight.
The Solution: Light Scattering
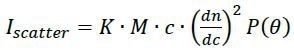
Online multi-angle light scattering (MALS)1,2 can determine the molar mass of polymers at each elution volume, absolutely, with no reference to retention time. This technique does so through a first-principles physical relationship between the molar mass (M), scattered intensity (Iscatter), scattering angle θ and concentration (c):
 |
Eq. 1 |
where dn/dc is generally known or can be readily measured for a polymer in any given solvent, P(θ) is an angular function that relies on the molecule’s rms radius rg, and K is the constant of proportionality that could be measured from the measurement system properties such as laser wavelength. Therefore, measurement of c and Iscatter directly yields the values of rg and M, contiguously, as the solution passes through the flow cell of the MALS detector. The determination of molecular weight is independent of shape, conformation, as well as elution properties.
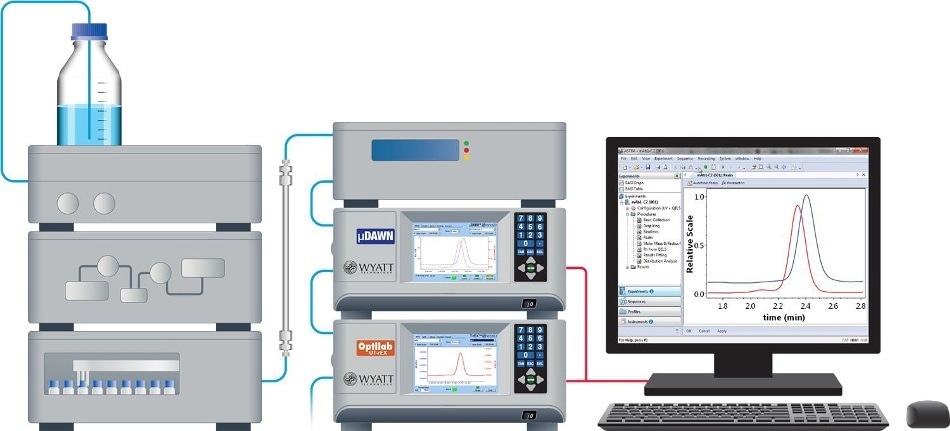
Due to these reasons, SEC-MALS, utilizing an Optilab® T-rEX differential refractometer and DAWN® MALS detector, has traditionally been the gold standard for stringent analysis of polymers and proteins in solutions isolated by standard HPLC-SEC. A SEC-MALS system, with the inclusion of a built-in WyattQELS™ dynamic light scattering (DLS) module, adds a second, independent determination of molecular size (hydrodynamic radius). Using a ViscoStar III for online measurement of intrinsic viscosity is another way to determine hydrodynamic radius generally used with polymers. Polymer conformation such as random coil, elongated or branched, can be determined by further analyzing the relationship between molecular size and molar mass.
The Optilab® UT-rEX refractive index detector and μDAWN® MALS detector for UHP-SEC3 confer the advantages of embedded DLS as well as MALS on the newer separation technology. UHP-SEC-MALS, also known under the trademark ‘μSEC-MALS™’, preserves the main advantages of UHP-SEC while maintaining chromatographic resolution and offering absolute molecular size and weight of the eluting species.
Figure 1 shows the significance of μSEC-MALS, presenting the chromatograms of a 30 kDa polystyrene standard with two injection volumes. An inexperienced interpretation of the chromatograms based on elution time would indicate that the 50 μL injection consists of mainly smaller species than those in the 4 μL injection. It would also suggest a broad molar mass range covering 20-40 kDa or 10-40 kDa in the respective peaks; however, MALS analysis reveals that both injections contained narrow distributions around 30 kDa.
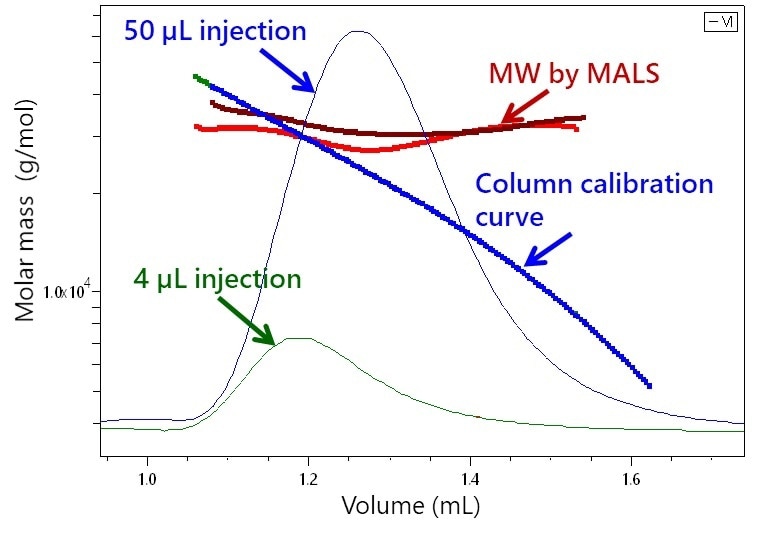
Figure 1. Elution of two injections of 30 kDa polystyrene (4 and 50 μL) by UHP-SEC overlaid with molar masses derived from light scattering. In contrast to the broad and disparate molar mass ranges implied column calibration, MALS proves that both contain narrow distributions around 30 kDa.
Knowns and Unknowns
Validating an unfamiliar technique against commonly accepted standards is always useful and even necessary. Such standards are linear polystyrenes for UHP-SEC, and SEC-MALS analyzes of a range of polystyrene standards are quite informative. The molar masses derived by light scattering perfectly align with the column calibration curve, as shown in Figure 2a. Yet, the flat MALS results across most of the peaks clearly show that these polystyrene standards are relatively homogeneous, something that could not be established with column calibration alone.
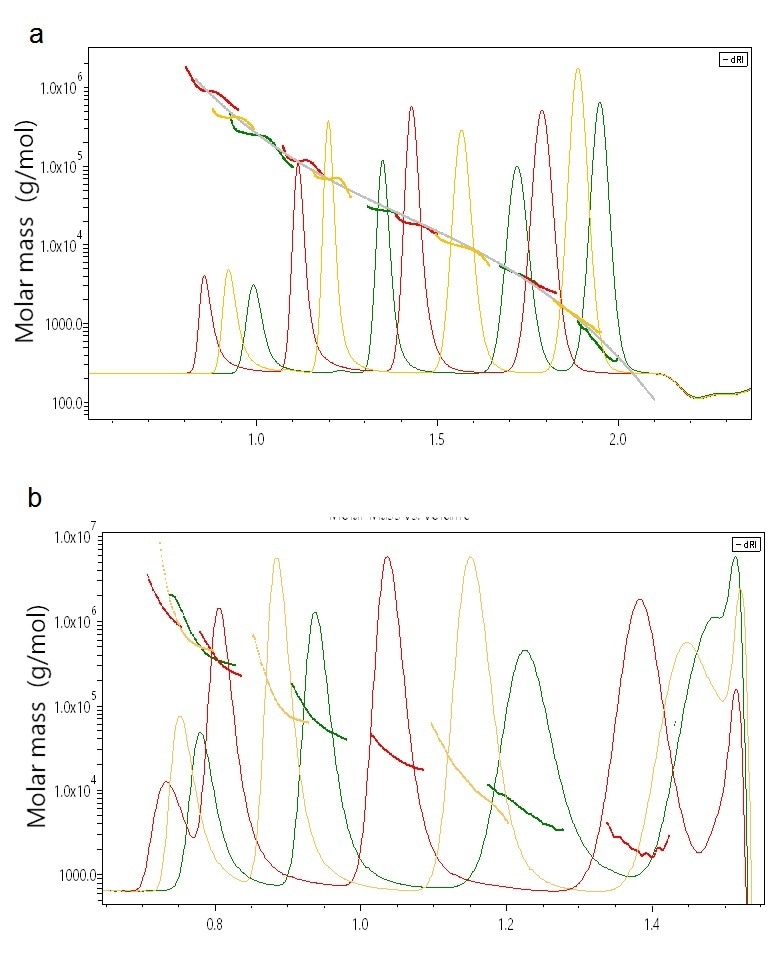
Figure 2. (a) Overlay chromatogram of a series of linear poly-styrene standards. MALS analysis indicates high correspondence of calculated molecular weights with the calibration curve and in addition provides the true homogeneity within each peak. (b) Overlay chromatogram of a series of PMMA samples. MALS analysis shows the deviations from column calibration which result from branched conformations as well as internal heterogeneity for each peak.heterogeneity for each peak.
On the other hand, PMMA elutes quite differently from linear polystyrene because of branching. As depicted in Figure 2b, the molar masses measured by MALS for these nominally ‘unknown’ samples do not align perfectly with one another as for the polystyrene standards, and each peak is fairly polydisperse. However, MALS gives a complete picture in terms of exact, accurate molar masses and distributions across the whole range from hundreds to millions of g/mol.
SEC-MALS vs. μSEC-MALS
It is important to validate a new method against standards and also essential to compare it against the old technique. For many years, SEC-MALS has been the de facto standard for assessing the molar mass and size of polymers. Current μSEC-MALS instrumentation covers the entire range of UHP-SEC columns (MW: 300 Da – 106 Da for linear polymers and higher for branched polymers, rms radius: 10 nm – 50 nm), although it does not cover the entire size range of standard SEC-MALS (MW: 300 Da – 109 Da, rms radius: 10 nm - 500 nm). Cross-validation has consistently demonstrated good agreement between μSEC-MALS and SEC-MALS. This comparison is especially illuminating in view of the concerns raised regarding the potential for shearing polymers under high pressure on the tightly packed UHP-SEC column.
Shown in Figure 3 is the analysis of a 1.5 MDa polystyrene sample, characterized by μSEC-MALS (red, early-eluting chromatogram) and SEC-MALS (green, late-eluting chromatogram), both at flow rates of 0.5 mL/minute. In both analyzes, the weight-average molar masses came out to precisely (1.56 ± 0.01) x 106 g/mol, and the z-average rms radii were almost identical at 63.0 and 61.5 nm, respectively. Therefore, it may be concluded that shearing does not take place, at least under these conditions. Potential for shear at higher flow rates is yet to be tested.
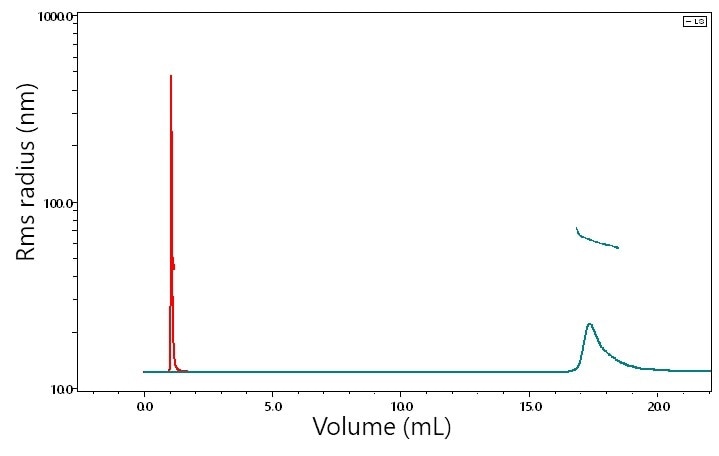
Figure 3. SEC-MALS (green, late-eluting) and UHP-SEC-MALS (red, early-eluting) chromatograms of a 1.5 MDa MW polymer, both at 0.5 mL/min. MALS analyzes of weight-average molar mass and z-average rms radii indicate no degradation on the UHP-SEC columns compared to standard GPC columns.
Nonlinear Conformation – Not an Obstacle
Polymers may take on a wide range of conformations, such as random coil, rod-like and branched. Each conformation denotes a different relationship between hydrodynamic volume and molar mass, and thus a different relationship between elution volume and molar mass.
Some epoxy resins, unlike polystyrene or PMMA, are elongated and stiff, just like rigid rods. The elongated shape of these epoxy resins creates a relatively large hydrodynamic volume and therefore they elute much earlier, for a given molar mass, than either of these macromolecules.
Shown in Figure 4a are three UHP-SEC chromatograms corresponding to these three types of polymers along with the molar masses measured by μSEC-MALS. Although this specific PMMA sample is not heavily branched and its molar mass/elution volume relationship only deviates slightly from that of polystyrene, the epoxy resin (EP) is clearly differentiated from the other two. At each elution volume, EP has a molar mass that is approximately 40-50% lower than the corresponding polystyrene species.
The difference in elution behavior is a direct result of the differing conformations. While this difference will not be recognized by standard analytical SEC, it is highlighted and immediately shown by MALS and the actual molar mass values are established.
The overlaid molar mass values and chromatograms determined for two EP samples are shown in Figure 4b. The almost perfect matchup of molar masses along the chromatogram suggest that these epoxy resins exhibit the same conformation, albeit they span different ranges and possess relatively different distribution shapes. Table 1 lists the moments and polydispersity values, which suggest excellent repeatability for each sample.
Analysis of copolymers is one of the most difficult tasks for polymer characterization. As no well-characterized, narrow reference standards are available for these relatively heterogeneous complexes, analysis by SEC with column calibration is not possible.
The most common method for analyzing copolymers is triple detection combining UV, MALS and dRI4. The combination of two separate concentration signals is more than enough to establish the weight-average dn/dc value and copolymer ratio that are subsequently plugged into the light scattering equation (Eq. 1) so as to find out the molar mass of each component in the complex and also the overall molar mass. All the major components of a triple-detection system for copolymer analysis are readily available and combine well in UHP-SEC format: UHPLC pumps and columns as well as online RI, UV and MALS detectors. Therefore, the standard method developed for SEC-MALS can be readily extended to μSEC-MALS.
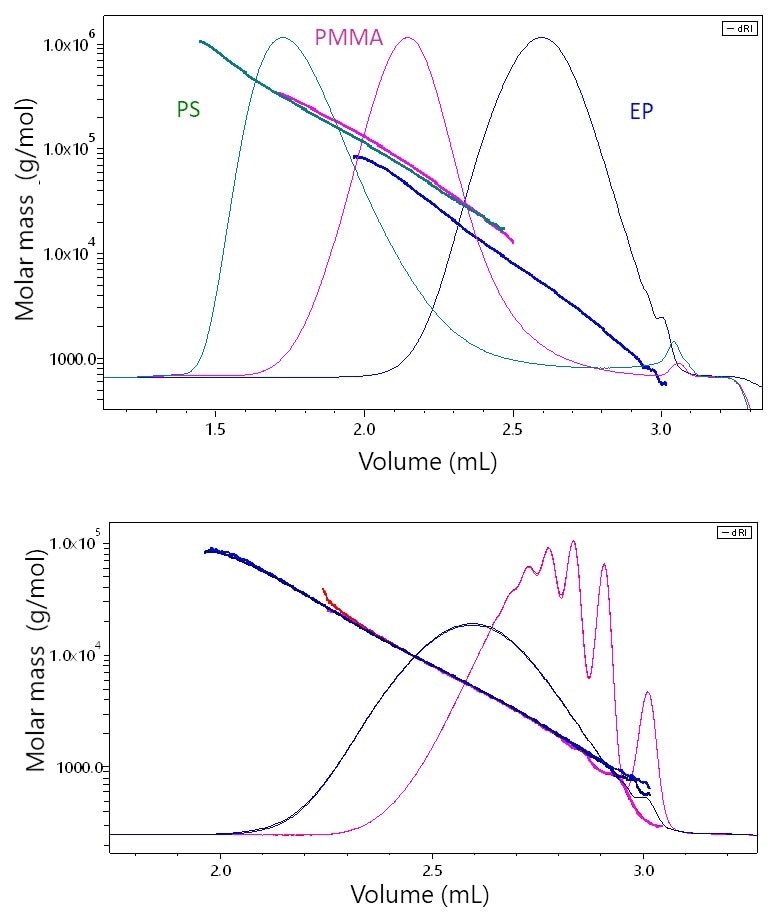
Figure 4. a) The elution behavior of stiff, rod-like epoxy (EP) vs. linear polystyrene (PS) or slightly branched PMMA by μSEC-MALS. At each elution volume, the molar masses of PS and PMMA are quite similar while that of EP is significantly lower, a consequence of its stiff, rod-like conformation. B) μSEC-MALS analysis of two epoxy resins samples. While one sample exhibits quite distinct low-molar-mass peaks, the molar masses overlay perfectly along the chromatogram, indicating that the two samples possess the same conformation.
Experiment
Instruments such as an Acquity® UPLC® system with APC 125 and 450 Angström pore SEC columns (Waters Corp., Milford, MA), an Optilab UT-rEX refractive index detector for UHPLC (Wyatt Technology), and a μDAWN MALS detector (Wyatt Technology Corp., Santa Barbara, CA) were used to acquire the data presented in this study and the same were analyzed using Wyatt Technology’s ASTRA® software. 4 - 20 μL injections and 0.5 – 1.0 mL/minute flow rate were the typical conditions. More tests have demonstrated that the elution volume of any given species may differ with flow rate; however, molar size and mass as established by light scattering do not, over a range of flow rates between 0.05 μL/minute and 2 mL/minute.
Table 1. Molar mass moments and polydispersity values along with experimental uncertainties (precision) for two epoxy resins, each with two replicates. The agreement between subsequent runs is quite good.
| |
Mn (kDa) |
Mw (kDa) |
PD (Mw/Mn) |
| EP1(001) |
1.55 ± 0.02 |
3.26 ± 0.01 |
2.10 ± 0.03 |
| EP1(002) |
1.55 ± 0.02 |
3.25 ± 0.01 |
2.10 ± 0.03 |
| EP2(001) |
3.58 ± 0.07 |
7.90 ± 0.02 |
2.21 ± 0.04 |
| EP2(002) |
3.47 ± 0.06 |
7.96 ± 0.02 |
2.30 ± 0.04 |
Conclusions
UHP-SEC offers a number of advantages for the characterization of macromolecules, including synthetic polymers, which range from hundreds to millions of g/mol in size. However, these can only be achieved with the use of a μDAWN online light scattering detector for absolute determination of molar size and mass, so as to resolve the inherent restrictions of size exclusion chromatography which may be exacerbated in the context of UHPLC. UHP-SEC-MALS is alas capable of characterizing complex molecules for example copolymers, elongated or branched polymers, which do not have available reference markers. As a result, light scattering is an important tool for analytical, process development and QC laboratories implementing UHP-SEC.
References
1. P.J. Wyatt, Analytica Chimica Acta 272, 1-40 (1993)
2. For brief overview of light scattering as applied to macromolecules and size-exclusion chromatography, see http://www.wyatt.com/Theory
3. V.H. Hsieh and P.J. Wyatt, Scientific Reports 7, article number: 10030 (2017)
4. S. M. Rowland and A. M. Striegel, Analytical Chemistry 84(11), 4812-4820 (2012)

This information has been sourced, reviewed and adapted from materials provided by Wyatt Technology.
For more information on this source, please visit Wyatt Technology.