Sponsored by HORIBAJun 12 2018
A-TEEM™ spectroscopy offers the ability to simultaneously obtain Absorbance, Transmission and a fluorescence Excitation Emission Matrix (A-TEEM) from a specific sample. Horiba are market leading pioneers with this technique, having developed the Aqualog® system; a system that offers incredibly fast results by using A-TEEM™ spectroscopy with simultaneous multichannel CCD detection.
A-TEEMTM spectrometers can be used for traditional fluorescence EEMs or absorbance measurements for multi-component analysis, but the system’s real potential is the way that the EEMs collected by the instrument are corrected for inner filter effect.
What this means in practice is that results gained via A-TEEMTM spectrometers are accurate, true representations of the molecules of interest. These results are usually over a far wider and more useful concentration range – generally up to ~2 absorbance units. As a result of this, these EEMs enable users to gain much more accurate fingerprinting than is possible via an EEM collected using a traditional scanning fluorometer.
A-TEEMTM spectroscopy is introducing the fluorescence technique into the analytical market, demonstrating that in some cases it is even able to replace traditional instruments such as a HPLC or mass spectrometer, providing a quicker, easier and more cost effective tool for analysis.
In order to harness the untapped power of fluorescence A-TEEMTM spectroscopy, multivariate software methods must be employed, such as Principle Components Analysis (PCA), Parallel Factor Analysis (PARAFAC) and the Classical Least Squared (CLS) method.
The majority of CDOM (Chromophoric Dissolved Organic Matter) components have broad, overlapping fluorescence excitation and emission spectra that fall within the UV and visible range. An array of sample measurements is utilized in order to create a model before using chemometrics to obtain scores of each component within an individual sample.
A fluorescence EEM can be used as a molecular fingerprint, and this unique trait makes it incredibly useful. Changes in the excitation spectrum, the emission spectrum, or even both, can be tracked with ease by using this 3D fluorescence method. This makes it of great practical use within water analysis and a whole range of other applications.
Uses of Simultaneous Absorbance/Transmittance and Fluorescence Excitation Emission Matrix Methods (A-TEEM)?
As previously mentioned, a common application for EEMs and one especially suited for A-TEEMTM is the analysis of the quality of water, particularly the study of CDOM.
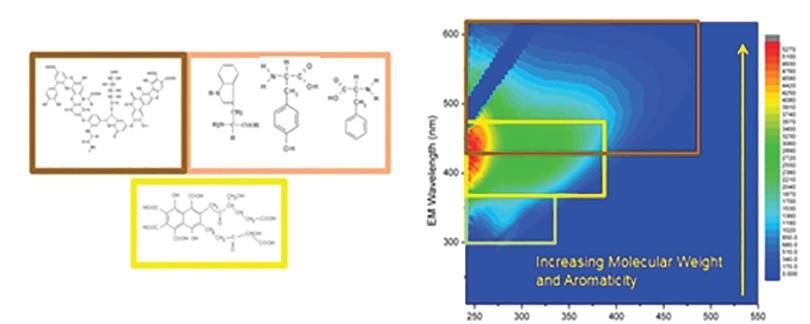
Figure 1. Common fluorescent compounds in water include humic acids, fulvic acids, and amino acids (left) and a typical EEM of waste water during various treatment processes (right)
This dissolved organic matter can include humic acids, fulvic acids, amino acids or a range of other types of decayed matter found within water sources. This can also include disinfection by-products from water treatment processes. A-TEEMs are used to identify the presence of each of these types of matter, often at very low concentrations in the ppb range.
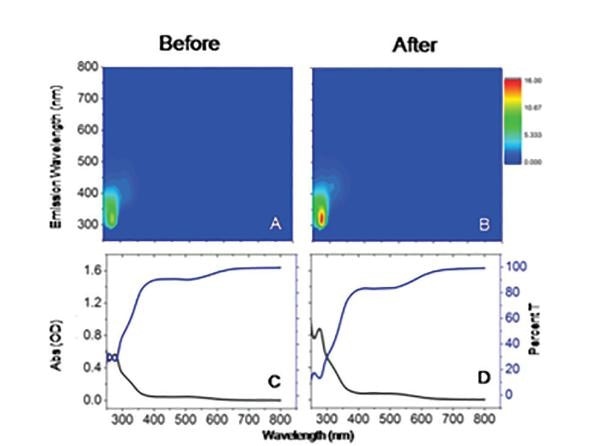
Figure 2. Fluorescence EEMs (A and B) and corresponding (C and D) Absorbance (OD) and %Transmittance spectra for an Italian wine sample before (A and C) and after (B and D) a one week oxidation treatment acquired on HORIBA Aqualog. (HORIBA App Note: FLSS-38, 2017)
EEMs also have practical applications in the study of drugs, proteins, petrochemicals and food science including beer, wine and a variety of other beverages. The following image illustrates a sample of an Italian wine that has been measured before and after a week-long oxidation treatment – that is, exposure to air.
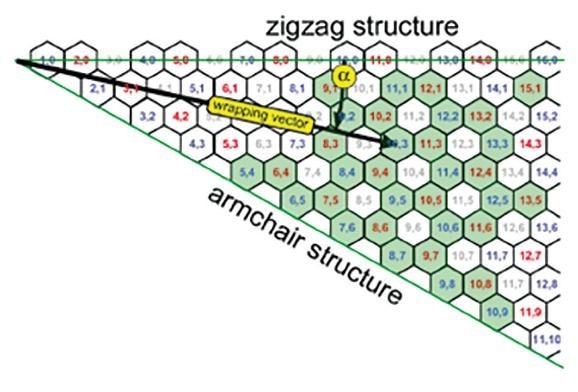
Figure 3. Indexed graphene sheet with wrapping vector designating nanotube structure. The helix angle, α and zigzag and armchair structures are shown. The pale gray indices are for nanotubes that do not fluoresce.
As can be seen above, the EEM and the corresponding absorbance spectra show a fingerprint of the wine, illustrating changes in the intensity and fluorescence spectral shape for components such as flavanols, caffeic acid, gentisic acid, anthocyaninie and epicatechin.
The individual EEMs, through the use of chemometric analysis, can also be used to characterize single walled carbon nanotubes. These carbon nanotubes are comprised of rolled sheets of graphene and can be either single walled or multiwalled - multiwalled sheets involve rolling several sheets of graphene at once, as explored by Dresselhaus (2000) and O’Connel (2002).
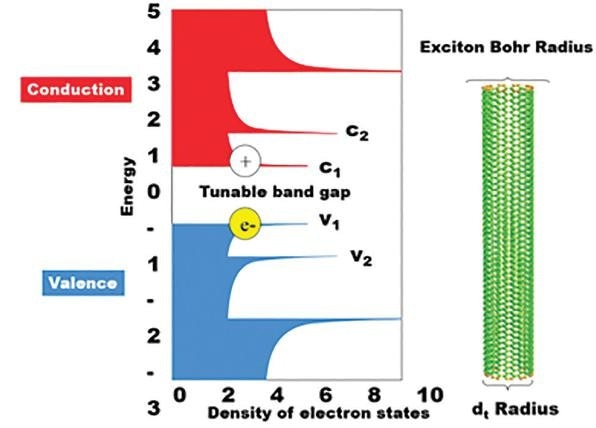
Figure 4. Conduction and valence energies versus the density of electron states for SWCNTs. The bandgap of single walled carbon nanotubes is dependent on the radius of the carbon nanotube, acting as an exciton Bohr radius. The absorbance is dependent on this band gap and hence the emission wavelength is dependent on the corresponding c2-v2 energy.
It should be noted, however, that only Single Walled Carbon Nanotubes (SWCNTs) emit photons due to their semiconductor properties.
The emission wavelengths and absorption of the SWCNT can also be affected by its helical folding angle (Bachilo, 2002). In this case, the carbon structure would be different depending on whether the graphene sheet is rolled at an angle or horizontally.
In this instance, the specific geometry can be understood in terms of the wrapping vector containing the length – that is the tube’s circumference – and a helix angle ranging from 0 to 30 °. The two numbers shown (n,m) are therefore used for SWCNT definition and the helix angle in terms of (n,m) is illustrated below.
The semiconductor within SWCNTs absorbs between the c2 and v2 energy levels, where the electron hole is passed down as illustrated below. Here, a photon is emitted at the band gap, or at the c1-v1 energy level. These specific emission and conduction bands very much depend on a carbon nanotube’s diameter, also known as an excitation Bohr radius.
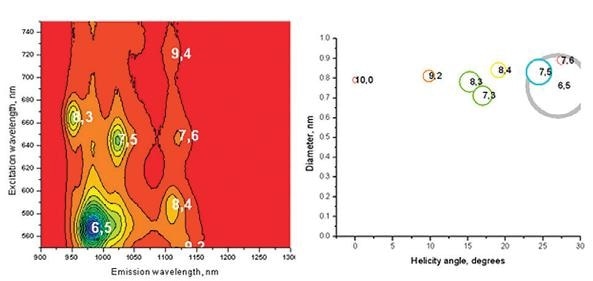
Figure 5. The EEM of a sample of single-walled carbon nanotubes acquired on a HORIBA Nanolog. Each peak can be fit and the excitation and emission wavelengths of those peaks give information about the diameter and helical folding angle of the carbon nanotube. From the EEM on the left, the distribution of carbon nanotubes in solution as a graph of diameter versus helicity, is plotted as is shown on the right.
The smaller this radius, the higher the energy – or shorter the wavelengths – of light emitted and absorbed. This relationship is a result of the quantum confinement effect which prescribes that the wavelength of the emitted light is restricted by the size of the particle. In this case, this would be the diameter of the tube.
What Is a Synchronous Scan?
A synchronous scan occurs when both the excitation and emission monochromators conduct a scan at the same time and the fluorescence emission is read out. It is generally possible to set an offset between the two types of monochromator which matches the Stokes Shift – that is the difference between the excitation and emission peaks.
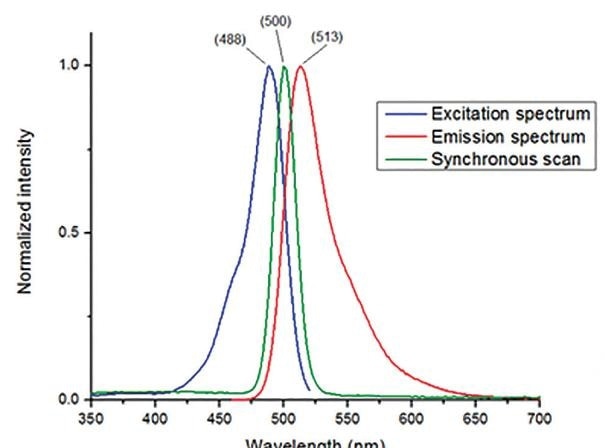
Figure 6. The fluorescence excitation spectrum, emission spectrum, and synchronous scan (Da=0 nm) for fluorescein in 0.1 N NaOH(aq) measured on a HORIBA FluoroMax-4
Synchronous scans such as these have been historically used for component analysis, but the development of more modern instrumentation for the measurement of EEMs with CCD detectors means that the EEM can now provide more information in the same timescale.
An offset of 0 nm can be set to ensure that the excitation and emission monochromators are scanning at the same time and at the same wavelengths. This is known as Right Angle Light Scattering (RALS) and results in what is actually a right-angle reflectance spectrum. This specific type of scan is used to measure the reflected or scattered light from the excitation.

This information has been sourced, reviewed and adapted from materials provided by HORIBA.
For more information on this source, please visit HORIBA.