Sponsored by HORIBAJun 14 2018
When light is scattered from a solution or a suspension, it undergoes random changes in intensity. This phenomenon helps us to determine the size of the particles that scatter the light. This is the principle of the dynamic light scattering (DLS) technique, formerly called quasi-elastic light scattering (QELS) or photon correlation spectroscopy (PCS).
This article explains the workings of the technique, the method of measurement and the interpretation of the data as well as some applications of DLS.
Applications for Dynamic Light Scattering
The most common setting for DLS is to perform an analysis of nanoparticles, such as size determination of gold nanoparticles, of protein molecules, of latex or of colloid.
It is ideal for measuring particles below micrometer scale, even with a diameter less than one nanometer. Within this range, molecules and particles are well distinguished as far as their size is concerned. Thus a protein or other macromolecule resembles a nanoparticle of gold in diameter, and also a liquid phase like an emulsion. DLS is also useful with concentrated solutions and other complex fluids, but this application is relatively rare compared to finding particle size.
Stokes-Einstein Equation: Particle Size and Particle Motion
Brownian motion is displayed by small particles in suspension, and consists of random thermal motion. The equation for this type of motion is given by the Stokes-Einstein equation. The form that is used most often for analyzing particle size is:
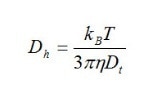
Where:
- Dh is the hydrodynamic diameter or particle size
- Dt is the translational diffusion coefficient found by DLS
- kB is Boltzmann’s constant which is already known
- T is thermodynamic temperature which is set by the operator
- η is dynamic viscosity, again a known constant
The instrument’s software performs the calculations based on this equation, of course, but the equation is important for several reasons. Firstly, the temperature at which measurements are performed is one of the parameters and is thereby shown to be a very important factor. Moreover, the temperature determines the viscosity which is again a factor in the equation.
Finally, it shows that particle size, as measured by DLS, is the hydrodynamic size, or in other words, the size of a spherical particle that shows the same diffusion characteristics as the particle being analyzed.
Protein size analysis and any other research area involving hydrodynamic radius involves a similar calculation using an additional factor of two.
When polymer size is under study, it must be noted that the hydrodynamic radius differs from the radius of gyration, being more easily measurable especially over a larger range of sizes. Converting one to the other involves using chain architecture models, including such issues as random coil or hard sphere, chain stiffness, dendrimer and the degree of branching.
Measuring Particle Motion I: Dynamic Light Scattering Optical Setup
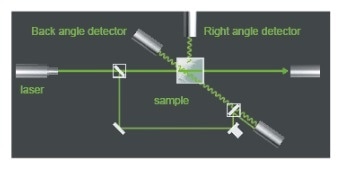
The above figure shows the optical setup for DLS.
Light sourced from a laser is passed through the cell sample and undergoes scattering. The scattered photons are then collected using two detectors at an angle of either 90 degrees or 173 degrees to the light beam, either of these being the angle of scattering. The use of a pair of detectors helps to modify the conditions under which the measurement is carried out more conveniently. The particles to be measured may be dispersed using any of a wide selection of fluids.
The only requirement is a knowledge of their liquid refractive index and viscosity to ensure that the results of the measurement can be properly interpreted.
The scattered light signal resulting from this changes randomly, as the particle position changes at random with respect to other particles. These signal variations are caused by Brownian motion. This is illustrated in the following graph.
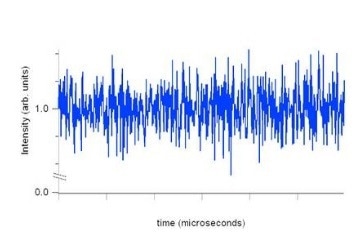
It should be noted that the “noise” seen in the graph is actually a reflection of particle motion, which is utilized to calculate the particle size. Unlike laser diffraction technology the measurements using DLS are carried out at just one angle, though it would be useful to have data from multiple angles. The benefits of this technique include its non-invasive character, because the particle motion is completely independent of the performance of DLS.
How to Extract Particle Diffusion Coefficient: DLS Data Interpretation
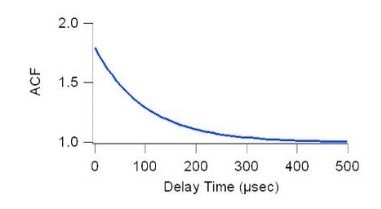
Signal interpretation is often carried out using an autocorrelation function on a correlator (a device which processes digital signals) in real-time to process incoming data. From this, it is possible to extract the autocorrelation function in relation to delay time, τ. This time parameter can be rapidly obtained by curve fitting to the experimental data. The diffusion coefficient is derived using the relation:
Γ=Dtq2,
Where:
- q is the scattering vector calculated by q=(4πn/λ)sin(θ/2).
- η is the liquid refractive index
- λ is the laser wavelength
- θ is the angle of scattering
When Dt is substituted in the Stokes-Einstein equation, we can solve for particle size.
Analyzing Real Particle Size Distributions I: The Method of Cumulants and Z-Average
Just as in the above section, DLS can be used to measure real samples containing nanoparticles covering an array of sizes. The exponential decay is now written in another form, namely, a power series, as below:
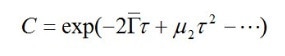
The decay constant is first extracted in order to find the particle size from its interpretation. The particle size in this case is a weighted mean size (the z-average size). Weighting is a somewhat complex process. The decay constant is directly related to the diffusion coefficient. DLS helps to determine the diffusion coefficient weighted for intensity. Since the diffusion coefficient is inversely related to the particle size, the z-average size turns out to be the harmonic mean size weighted for intensity.
This interpretation is at variance with the standard interpretation for the z-average radius of gyration of a polymer determined via light scattering.
A simple meaning of the z-average size is that it increases with increasing particle size and it can be measured with good reliability. Thus this definition has become the standard for determining particle size using DLS.
Analyzing Real Particle Size Distributions II: Size Distribution Data
Size distribution can also be analyzed using DLS measurements. The measured autocorrelation function is converted into an electric field autocorrelation function, g1(τ). Using the known relationship for each,
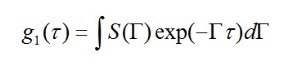
value which can be assigned to the decay constant Γ, it is possible to arrive at the overall electric field autocorrelation function or the intensity-weighted sum of the decays caused by each particle in the system.
If this equation is inverted, so that the values determined for g1(τ) are used to find the S(Γ) values, the size distribution can be determined. However, this is a badly constructed problem. Yet the fact remains that it helps to interpret DLS–derived data.
Conclusion
We have investigated how DLS helps to measure particle size. Many interesting departure points for investigating the relationship further have been discussed. The HORIBA DLS equipment is built with standard capability to handle these equations and to analyze them. This is used to apply DLS for the measurement of the sizes of protein, colloid or nanoparticles, among others.

This information has been sourced, reviewed and adapted from materials provided by HORIBA.
For more information on this source, please visit HORIBA.