The delivery of an optimal and consistent particle size distribution adds value to electrode materials, and it is important to ensure the quality of a final product. This enables manufacturers to optimize slurry viscosity and flow behavior, coating packing density and porosity, battery cell charge rate capacity and cycling durability.
With this in mind, Malvern Panalytical provides a particle size measuring tool that meets industry standards, called the Mastersizer 3000. Founded on laser diffraction, it provides industrial-level performance, with the ability to deliver more reliable and faster measurements in comparison to sieving and sedimentation, and is statistically superior information in comparison to microscopy.
The Mastersizer 3000 laser diffraction particle size analyzer supplies fast and accurate particle size distributions for both wet and dry dispersions with the low levels of effort. It measures over the nanometer to millimeter particle size ranges, thus performing exceptionally into the smallest of footprints, resulting in operator-independent measurements that each user can rely on.
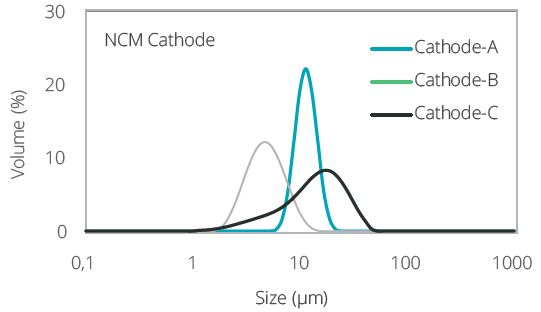
Figure 1. Particle size distribution of three batches of NCM811 cathode materials synthesized with different processing parameters. Image Credit: Malvern Panalytical
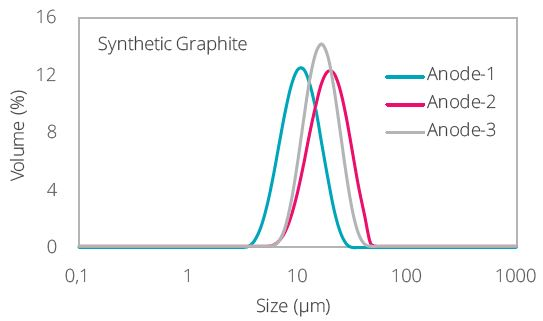
Figure 2. Particle size distribution of three batches of synthetic graphite synthesized with different heating conditions. Image Credit: Malvern Panalytical
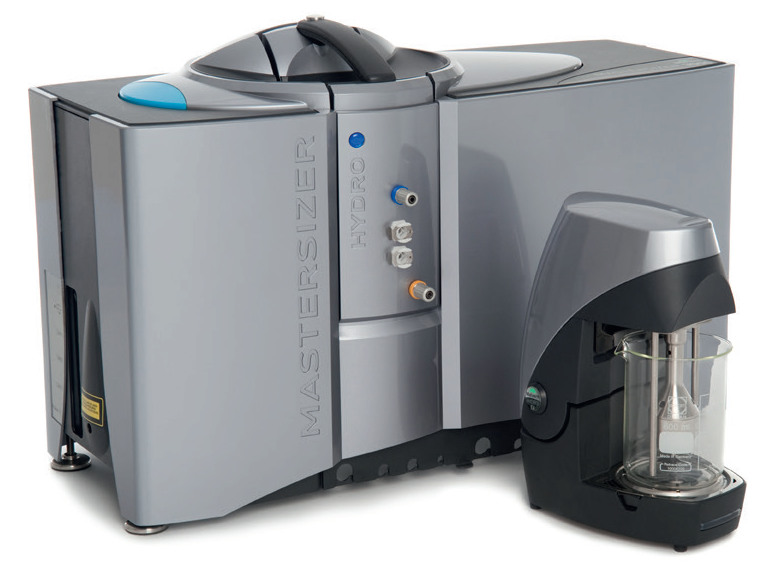
Image Credit: Malvern Panalytical.
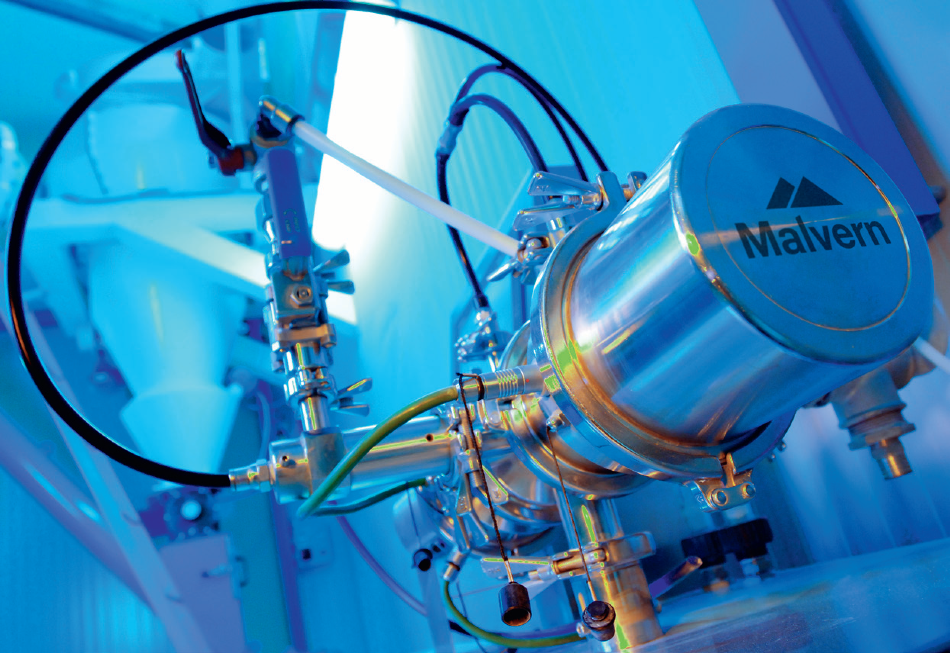
Image Credit: Malvern Panalytical.
Real-Time Process Automation
Optimization of Process Parameters
As the production process continues, manufacturers are also required to monitor particle size. Additionally, if businesses are manufacturing at industrial scale with reduced human resources, discovering an effective way to analyze particle size in real time can be challenging. Typically, lab analysis can provide feedback in approximately one hour, however, for optimal quality control, a feedback loop of a few minutes is needed.
Malvern Panalytical has an on-line, automated Insitec particle size analyzer that is perfect to meet this requirement in a production environment, providing real-time analysis every few seconds using a feedback loop.
It can be utilized to control precursor particle size evolution over time, or immediately after milling in order to control electrode particle size. This enables manufacturers to decrease waste and align their processes with smart factory manufacturing flows.
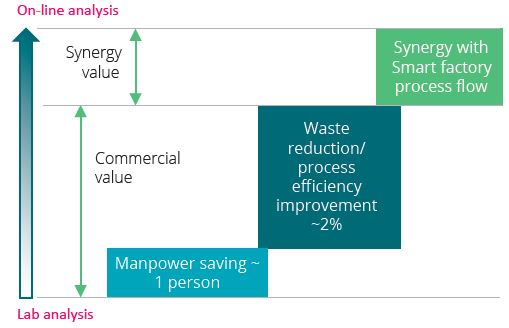
Typical value gain for a cathode manufacturing plant with Insitec online particle size analysis of precursor slurry, in comparison to lab analysis. Image Credit: Malvern Panalytical.
Superior End-to-End Gauging Solutions
The Potential of New Process Control
With regards to electrode coatings, coat weight and thickness consistency are crucial. Small discrepancies in coat weight or thickness uniformity could dramatically affect the efficiency of the process and final battery performance.
Additionally, when the measurements are so important, component manufacturers require rapid, efficient ways to measure these variations. In response to these challenges and in order to provide incomparable process visibility and control, Malvern Panalytical has teamed up with their sister company, NDC, and have designed an end-to-end gauging system.
These tools open new levels of control and precision that provide superior process reliability and ultimately industry-leading, quality batteries. Benefits can be seen from the basis weight measurement of electrode battery coatings to end product thickness measurement following the roll press line.
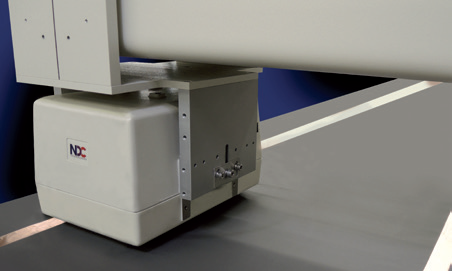
Image Credit: Malvern Panalytical.
Photon Sensor
The Delivery of Unparalleled Coat Weight Accuracy
Even the slightest discrepancies in anode or cathode weight measurement can make huge differences. If coats are too thin or too thick, or there is any form of irregularity on aluminum and copper foil substrates, serious compromises can occur with final battery performance.
NDC has delivered a dedicated Photon Sensor so that these problems are a thing of the past. In particular, this pioneering solution provides the industry’s highest coat weight accuracy, and offers ultra-quick measurements on patch, zone, and continuous coating lines.
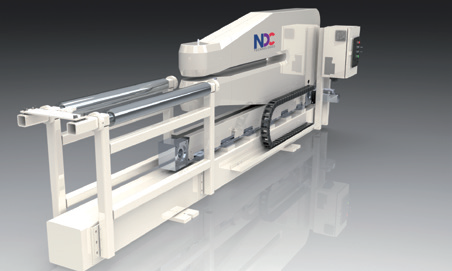
Image Credit: Malvern Panalytical.
MicroCaliper Thickness System
Driving Roll Press Process Quality
The roll press process frequently affects the quality of battery component coatings. As a result, it is possible that the process efficiency, throughput volume and end product quality is compromised. NDC’s specialized MicroCaliper Thickness Sensor solves this problem through the delivery of repeatable, sub-micron accuracy for superior insight into thickness variations. This enables battery manufacturers to produce the most consistent, highest-quality products on the market.
Particle Morphology
Improved Insight into Electrode Material Morphology
The role of particle shape in battery electrode materials often goes unnoticed or is underestimated. However, it is possible that this is the key to unlock the full potential of a given battery material to be transformed into a battery with optimal performance.
Particle shape affects slurry rheology, in addition to the electrode coating in relation to packing density, porosity and uniformity. For the achievement of the highest level of battery performance, manufacturers need to have a better understanding of and optimize the particle morphology.
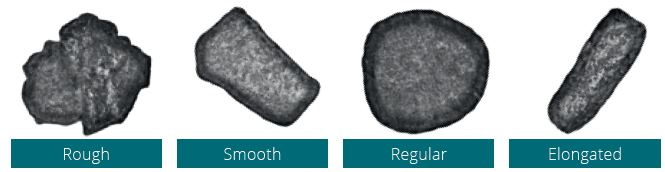
Image Credit: Malvern Panalytical.
To aid manufacturers in solving these important issues, Malvern Panalytical offers a powerful optical imaging tool called Morphologi 4. It is equipped with image analysis that is fully automated, and it allows manufacturers to measure parameters like circularity, elongation/aspect ratio, Circular Equivalent (CE) diameter, and transparency.
With analysis based on 10,000 – 500,000 particles from 0.5 µm and up, manufacturers can obtain reliable insight into the shape of the smallest particles with high statistical accuracy. Additionally, the Morphologi 4-ID uses automated static imaging features of the Morphologi 4 in combination with chemical identification of individual particles using Raman spectroscopy. This enables automated measurements of particle size, particle shape and chemical identity, on a single platform.
Image Credit: Malvern Panalytical.
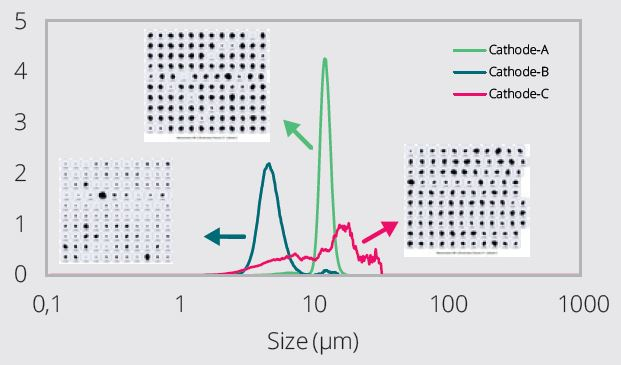
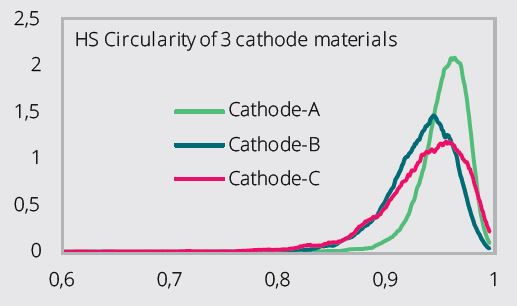
Figure 3 (Top) and Figure 4 (Bottom). Example Cathode Materials Circular Equivalent (CE) size distribution of three NCM cathode materials, as obtained from Morphologi 4 (Figure 3). These are the same samples as those measured with the Mastersizer 3000 in Figure 1. Circularity for these samples is compared in Figure 4. Circularity index 1 corresponds to perfect spheres and smaller values to larger deviation from circularity. A narrow distribution in circularity means uniform shape particles, whereas broad distribution represents large variance in particle shapes. Cathode A has circular particles, whereas B and C are irregularly shaped with large shape variations. Image Credit: Malvern Panalytical.
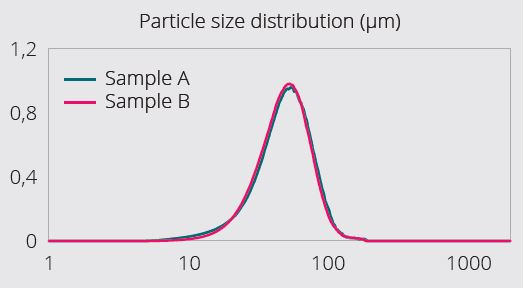
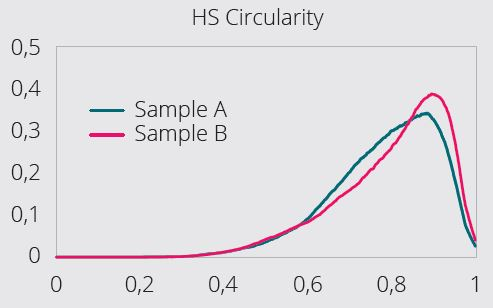
Figure 5 (Top) and Figure 6 (Bottom). Example Graphite electrode material: size distribution of two samples as measured with Mastersizer 3000 (Figure 5) and circularity of the same samples (Figure 6) as measured with Morphologi 4. Though the samples have similar circular equivalent size distribution, sample A is more irregular in shape. Image Credit: Malvern Panalytical.

This information has been sourced, reviewed and adapted from materials provided by Malvern Panalytical.
For more information on this source, please visit Malvern Panalytical.