Raman microscopy has become one of the most important characterization tools in the polymer field because of the large number of chemical and structural information that could be extracted from a single result.
So, Raman microscopy can help from the synthesis process to defect investigation, from raw material characterization to genuine product control, covering the whole process of polymers manufacturing.
In this article, these unique capabilities of Raman microscopy are outlined, focusing on some academic and industrial applications for the polymers field.
Raw Material Characterization
Raman microscopy is an optical method supplying spectra based on the polarization changes of molecular vibrations. Each band of a Raman spectrum is the fingerprint of a specific molecular vibration in its chemical environment. So, each molecule will have its specific Raman spectrum.
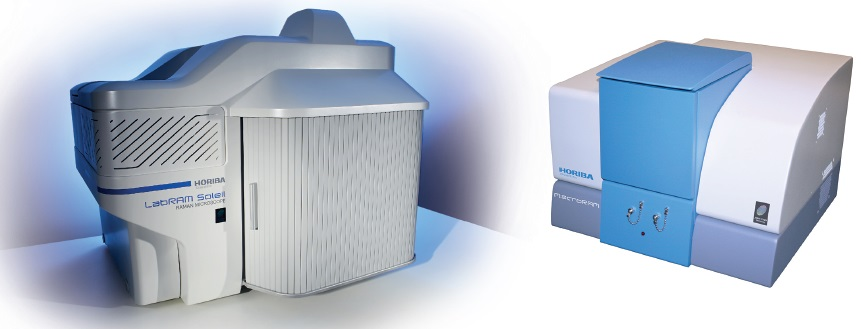
Figure 1. The Raman solutions for the polymer industry from HORIBA. Left: LabRAM SoleilTM. Right: MacroRAM.
Thus, two molecules which are based on similar chemical bonds, but which possess a different chemical structure, will have two different Raman spectra. By cataloging a collection of spectra, Raman spectra can be utilized as identification tools.
Today, a large amount of spectra are already cataloged and converted to a robust spectra library, which can be installed on the instrument computer for quick, automatic, and precise identification by software.
Figure 2 shows how simple it can be to identify an unknown polymer from its Raman spectrum. For example, polymers with a carbonyl group have a band between 1650 and 1750 cm-1.
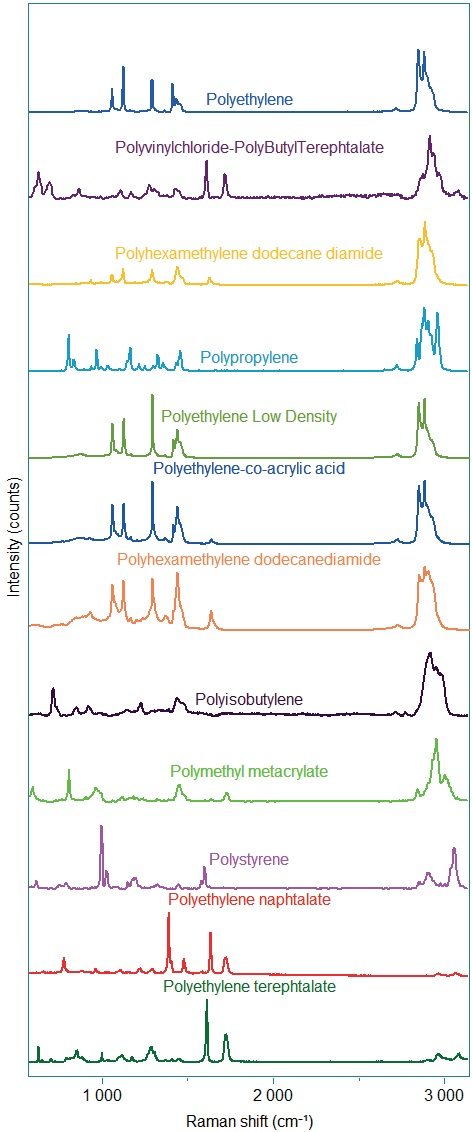
Figure 2. Raman spectra of different polymers.
A Raman instrument with high sensitivity and a good spectral resolution is needed for such spectral differentiation. Using a state-of-the-art Raman microscope such as the HORIBA LabRAM SoleilTM it becomes easy to characterize the exact type of polymers.
This system is indeed the perfect combination of spectral resolution, spatial resolution and sensitivity, all integrated in a simple-to-use platform.
Polymerization Process Monitoring
The characteristics of the Raman microscopy instrument (non-destructive, non-invasive, in-line measurements) make it an ideal tool for polymerization monitoring.
Monitoring the polymerization becomes simple by utilizing specific process probes, coupled with an integrated Raman instrument as MacroRAM, as each process compound has its own fingerprint. Figure 3 shows an example of process monitoring.
Where the polymer contribution increases during this polymerization process, the concentrations of reagents (VC2 in green and ACM in purple) decrease over time.
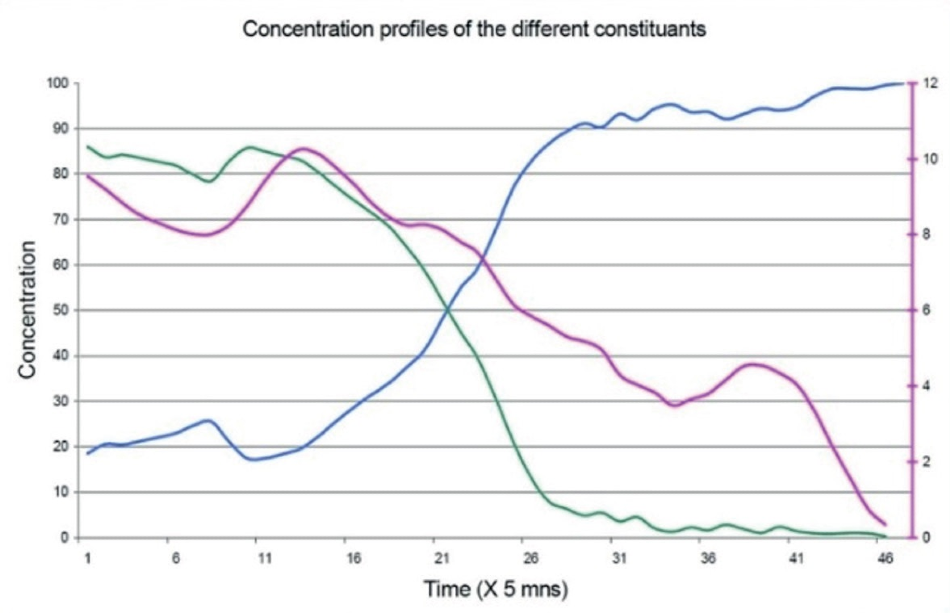
Figure 3. Polymerization monitoring based on Raman microscopy. Reagents are in green (VC2) and purple (ACM), polymer synthesized in blue.
Orientation and Crystallization
Polymers usually "orient" when extruded, which means that the molecular axis aligns along the extrusion direction. By orienting the sample in the instrument coordinate holder and analyzing the polarization of the Raman light, it is viable to infer information about the orientation of the polymer.
This can affect the mechanical and other physical properties of the polymer. For instance, RichardLacroix & Pellerin (Macromolecules, 2012, 45,1946-1953) establish that confocal Raman microscopy is a powerful technique to quantify molecular orientation and structure at the individual fiber level.
They used this method on single electrospun nanofibers which we utilized for producing nanomaterials for catalysis, drug delivery, biosensors, and other applications. On these fibers, it is a critical point to be able to characterize them one by one. Using the HORIBA LabRAM HR Evolution, that can be easily acquired.
Polymers can exist in a crystalline form, like inorganic materials and molecular crystals. The degree of crystallinity which is typically not more than 50%, is established by the thermal and stress history of the sample.
Thermal and stress modifications induce very small spectral changes, seen as spectral shifts of the bands. The highest spectral resolution becomes necessary in order to see such shifts.
The HORIBA LabRAM HR Evolution is the ideal solution for thermal and stress investigations. So, by following some details in the spectra, one is able to monitor the crystalline form of polymers. For example, in polyethylene terephthalate, the >C=O band tends to sharpen significantly in the crystalline form.
Adar and Noether, Raman Microprobe Spectra of Spin-Oriented and Drawn Filaments of Polyethylene Terephthalate, Polymer, 1985 26 1935-1943 has documented both the influence of both orientation and crystallinity in the Raman spectra of polyethylene terephthalate fibers.
Genuine Product Control
Usually, to improve the physical and chemical properties of the desired product, polymer films are combined. Multilayer films are developed for this reason, where each layer brings its own physical and chemical characteristic to the final product.
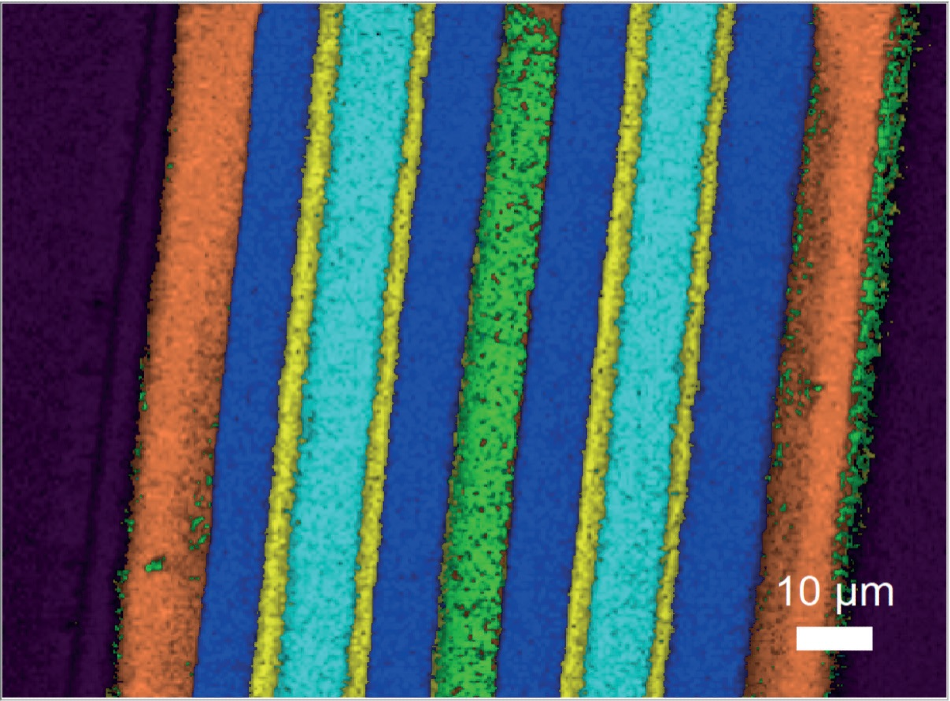
Figure 4. Multilayer film characterization by Raman mapping. Each color represents a specific type of polymer. Orange: Low-density polyethylene. Blue: Blue low-density polyethylene, Cyan: Ethylene vinyl alcohol, Green: Ethylene-vinyl acetate, Yellow: Polyamide.
In polymers, the thickness of the different layers, the order, and the layered stitching, in addition to the crystalline form and the polymer orientation, are vital parameters. The HORIBA LabRAM SoleilTM Raman microscope is the ideal tool to characterize these products based on its high spatial resolution and selectivity, at micron size.
Figure 4 shows an example of a multilayer film characterization. This sample is the combination of low-density polyethylene (orange), blue low-density polyethylene (blue), ethylene vinyl alcohol (cyan) and ethylene vinyl acetate (green), interlayered with polyamide (yellow).
Defect Investigation
The investigation of defect sources is another key requirement for the polymer industry. These defects can be the result of a polymorphism issue, an outlier during the manufacturing process, or simply from a physical or temperature stress and/or strain on the film.
All of these sources can be determined based on the Raman spectrum of the defect. Confocal Raman microscopy enables a high spatially resolved characterization of multilayered film on the surface, but also along the depth axis of the film.
The HORIBA LabRAM SoleilTM microscope is the perfect tool to characterize and investigate the origin of defects, with its true confocal pinhole and its high sensitivity. Such investigation is shown in Figure 5, by using the capabilities of outstanding LabSpec 6 software, presenting a 3D Raman mapping of a multilayer film with visible defects.
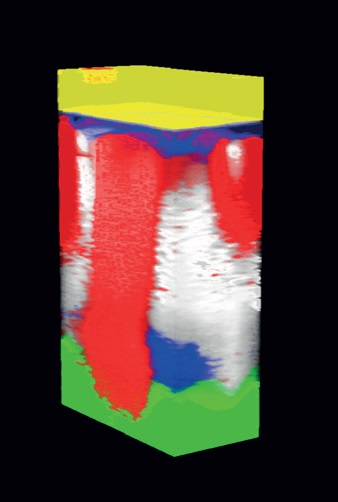
Figure 5. 3D Raman map of a multilayer film polluted with an outlier (white). Yellow: Polypropylene, Blue: Polyethylene, Red: Polyethylene low-density, Green: Polyvinyl-chloride, White: Polyamide.
The Raman map shows the different layers (yellow: polypropylene, blue: polyethylene, red: polyethylene low-density, green: polyvinyl-chloride), but also the presence of an outlier (white: polyamide). It becomes simple to understand that the outlier occurred in the manufacturing process at the level of the red layer Based on the Raman map.
References and Further Reading
- Raman Microprobe Spectra of Spin-Oriented and Drawn Filaments of polyethylene terephthalate”, Adar & Noether, Polymer, 1985, 26, 1935-1943.
- “Orientation and Structure of Single Electrospun Nanofibers of Poly(ethylene terephthalate) by Confocal Raman Spectroscopy”, Richard-Lacroix & Pellerin, Macromolecules, 2012, 45,1946-1953.
- “Polarized Raman analysis of polymer chain orientation in ultrafine individual nanofibers with variable low cristallinity.”, Papkov and al., Macromolecules, 2018, 51(21), 8746-8751.
- “Cold gas spray titanium coatings onto a biocompatible polymer.”, Gardon M. and al, Materials Letters, 2013, 106, 97-99.
- “Direct detection of analyte binding to single molecularly imprinted polymer particles by confocal Raman spectroscopy.”, Bompart M. and al., Biosensors and Bioelectronics, 2009, 25(3), 568-571.
Acknowledgments
Produced from materials originally authored by Thibault Brulé, Céline Eypert and João Lucas Rangel from HORIBA FRANCE SAS.

This information has been sourced, reviewed and adapted from materials provided by HORIBA.
For more information on this source, please visit HORIBA.