In the manufacture of pharmaceutical vaccines, intermediate, starting, and end products must be tested for the level of antigens. They are measured for the amount of devitalized or attenuated bacteria or viruses. The analytical measurement of total protein is the technique of choice as these antigens usually include proteins.
Several suitable methods are listed by the pharmacopoeia regulations, among them are a number of UV/Vis assays (such as Lowry, Bradford, BCA assay) and two total nitrogen techniques, which is the catalytic combustion and the Kjeldahl method.
This article centers on the catalytic combustion technique, which is detailed in Pharm. Eur. Monograph 2.5.33, Method 7 B: high-temperature pyrolysis of the nitrogen compounds in an oxygen atmosphere to nitric oxide (NO) followed by chemiluminescence detection (CLD).
The description of this method almost coincides with the EN 12260, which outlines the measurement of TNb in environmental water samples through catalytic high-temperature combustion and CLD detection of the formed NO molecules.
These analyzers can be used for the determination of TNb in pharmaceutical products as well, as this is what multi N/C analyzers are designed for. The level of antigens can be found by converting the TNb into total protein.
As the content of nitrogen in proteins differs, it is generally suggested to convert the total concentrations of nitrogen into total concentrations of protein by multiplying a factor of 6.25 in relation to the following formula: C [Total Protein] = c [total nitrogen] x 6.25.
Materials and Methods
Instrumentation
The multi N/C 2100S pharma was used to perform the analysis. Table 1 presents the method settings which were utilized to measure the TOC content.
Table 1. Method settings
| Parameter |
multi N/C 2100S pharma |
| Measurement parameters |
TNb |
| Digestion |
High-temperature digestion at 800 °C with platinum catalyst |
| Number of single repetitions |
min. 3, max. 4 |
| Rinse with sample before injection |
3 times |
| Injection volume |
75 µL |
| Dilution |
1:1 |
Samples and Reagents
Three unknown customer samples, one BSA control standard, and five urea TNb calibration standards prepared at the site of a customer were analyzed in triplicate determination. Prior to analysis, the samples were kept at 4 °C in the refrigerator.
After the liquid samples were conditioned at room temperature, a micropipette and snap-caps were used to cover and directly transfer them into 2 mL sample vials. The microliter syringe of the autosampler was used to transfer 75 µL of sample aliquots into the furnace of the analyzer.
Utilizing catalytic high-temperature combustion and supported by the platinum catalyst, all compounds of nitrogen were converted to nitrogen monoxide (NO) in a pure oxygen environment.
A chemiluminescence detector (CLD) was then used to quantitatively measure the NO. The sequence of measurement was assisted by the autosampler AS 60 with a syringe wash station and automatic magnetic stirring of the sampling position.
Calibration
A multi-point calibration with a BSA protein standard solution was used to calibrate the multi N/C system from 5 to 60 mg/L for total bound nitrogen (TNb). A 200 mg TN/L stock solution of BSA was created (Sigma Art.Nr. A-7906, Bovine, Albumin, with a 98% purity grade and a 15.60% N-content) weighing 128.2 mg for 100 mL ultra-pure water.
The protein concentration of the analyzed samples was determined by calculating the protein concentration from the measured N concentration of 6.25 which is the standard conversion factor for this type of sample found in literature. Figure 1 demonstrates the calibration curves.

Figure 1. Example of TN – BSA Calibration curve and characteristics range 5 – 60 mg/L N.
Results and Discussion
Each sample has been analyzed for a minimum of three times.
Table 2. Liquid samples.
| Sample ID |
Mean value
TNb [µg/mL] ± RSD [%]
(1. vial) |
Mean value
TNb [µgm/L] ± RSD [%]
(2. vial) |
Mean value
TNb [µg/mL] ± RSD [%]
(3. vial) |
| 10 ppm Nitrogen Std |
10.77 ± 0.14 |
10.80 ± 0.51 |
10.74 ± 0.19 |
| 20 ppm Nitrogen Std |
20.02 ± 0.20 |
20.05 ± 0.27 |
19.98 ± 0.24 |
| 30 ppm Nitrogen Std |
30.31 ± 0.43 |
30.35 ± 0.28 |
30.42 ± 0.30 |
| 40 ppm Nitrogen Std |
40.59 ± 0.27 |
40.62 ± 0.42 |
40.65 ± 0.35 |
| 50 ppm Nitrogen Std |
50.74 ± 0.11 |
50.96 ± 0.13 |
50.95 ± 0.29 |
| 30 ppm BSA checking Std |
30.80 ± 0.54 |
30.89 ± 0.45 |
30.88 ± 0.40 |
| Sample A |
17.22 ± 0.34 |
17.20 ± 0.52 |
17.18 ± 0.44 |
| Sample B |
27.95 ± 0.22 |
27.97 ± 0.21 |
27.93 ± 0.40 |
| Sample C |
48.27 ± 0.34 |
48.25 ± 0.17 |
48.05 ± 0.09 |
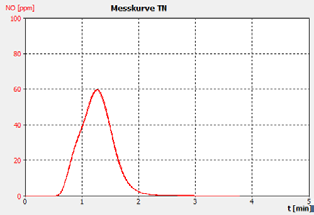
Figure 2a. Example 30 ppm BSA checking Std.
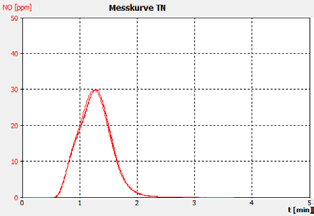
Figure 2b. Sample A.
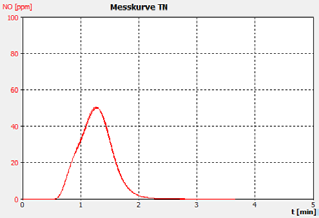
Figure 2c. Sample B.
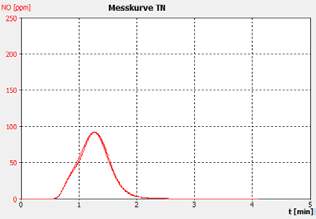
Figure 2d. Sample C.
Conclusion
All samples were quantified with low RSD’s and very high repeatability. The distinct benefit of using a direct injection system with a microliter syringe is the direct and efficient transfer of the sample from the vial to the combustion furnace without long tubings and valves.
This enables better small rinse volumes of maximum three times 75 µL. Consumption of the sample can be kept to a minimum. Less than 1.4 mL of sample are required for five replicates entailing three rinse cycles and a representative injection volume of 75 µL.
multi N/C 2100S pharma equipped with a CLD detector for the determination of nitrogen content is the ideal system to carry out total protein analysis for these samples in line with the catalytic high temperature digestion technique outlined in Pharm.Eur. 2.5.33 Method 7B.
The performance of the analyzer is proven by the demonstrated peak shapes of the sample runs, which demonstrate no significant peak tailing or shifts between replicates, along with the recovery of the customer calibration standard solutions and the checking standard (BSA).

This information has been sourced, reviewed, and adapted from materials provided by Analytik Jena US.
For more information on this source, please visit Analytik Jena US.