A range of semiconductors, optical coating, sensors, flexible electronics and micro-electromechnical systems (MEMS) are reliant on precise thickness or etch-depth measurements.
Dektak® stylus profilers are an ideal choice for many of these applications, with their metrology capabilities, including exceptional sub-nanometer repeatability – a key consideration when working with step height measurements over the nanometer-to-millimeter vertical range.
By precisely managing these systems’ applied load, it is possible to achieve accurate and repeatable metrology for a range of soft matter, including polymer thin films/coatings and indium-based devices.
This article explores the capabilities of Dektak metrology over vertical dimensions (a diverse array of certified step heights).
It offers specifications, case examples and performance benchmarks, illustrating why these profilers have met materials engineers and manufacturers’ surface characterization needs for over half a century.
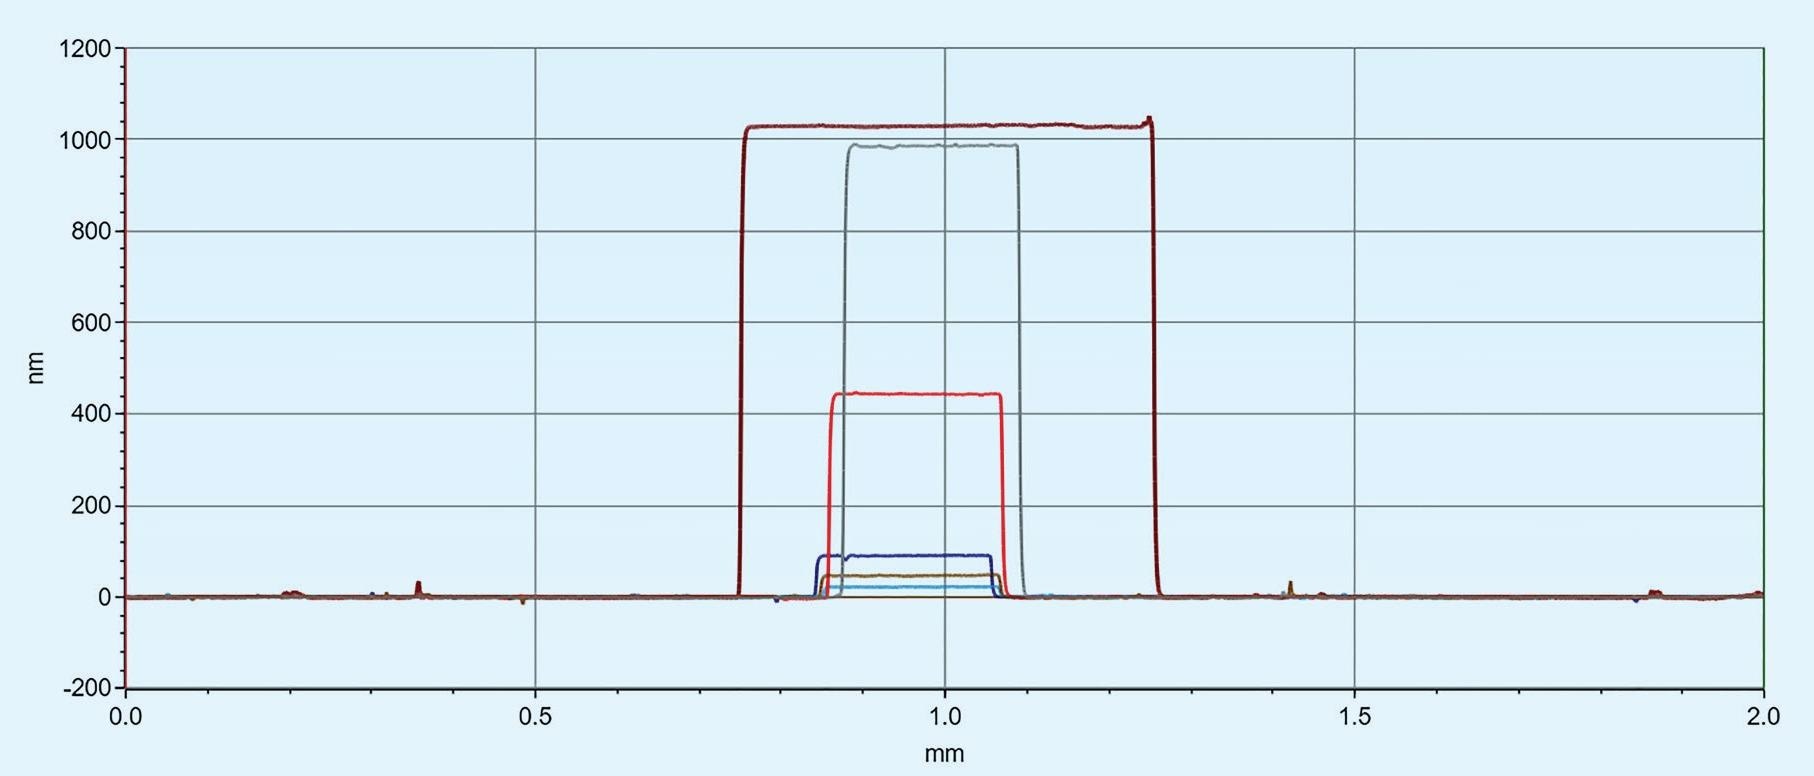
Figure 1. Representation of six steps within the same diagram, default feature from Vision64 software. Image Credit: Bruker Nano Surfaces
Definition of Metrology Terms
Metrology capability can be understood as a measurement of instrument performance, and this can be evaluated by listing and quantifying sources of error in order to ascertain whether or not the system is suitable for a particular task.
Errors are benchmarked against standards certified by independent metrology reference laboratories, for example, PTB in Germany, UKAS/NPL in the UK, NIST in the USA or NMIJ in Japan.
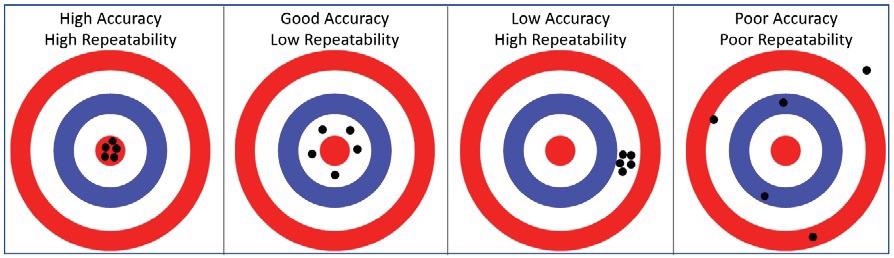
Figure 2. Graphic illustration of Accuracy and Repeatability versus target value. Image Credit: Bruker Nano Surfaces
Sources of errors are divided into four categories:
- Bias refers to the difference between the output result and its actual value. Bias is often considered the accuracy of a measurement.
- Stability refers to the degree of drift in output results over a defined period of time.
- Repeatability can be understood as inherent random fluctuation in output results when measuring the same location over a short period of time, without user interaction. Repeatability highlights an instrument’s precision, defining fixed boundaries below which a measurement would be deemed invalid.
- Reproducibility considers the impact of external parameters on measurements, for example, operator, time or repositioning.
Repeatability is intrinsic to the performance of a measurement system, and it is impossible to improve this without hardware changes.
It is possible to improve reproducibility, however, by leveraging the power of robust analysis and automation routines to make measurement less sensitive to, or even wholly independent of, time, location or users.
Accuracy or bias can be enhanced via a thorough calibration process, while stability improvements can be achieved via environmental control and/or a full redesign of the measurement system.
Automatic Step Extraction
Calculating step heights using automated analysis routines is essential to minimize user influence. To this end, Dektak systems make use of two standard automated analysis routines provided by the Vision64® software.
The first one of these analysis routines is based on the fixed position of cursors, while the second is based on automatic cursor positioning in relation to the step edge.
In the second routine, the average height difference between cursor positions will determine the film thickness or etch depth.
Users are also afforded the freedom to customize settings for more advanced analysis, using an analysis tree to set up data pre-processing.
Influence Factors for Accuracy
Dektak stylus profilers feature the current generation of LIS-3 heads. These are based on Linear Variable Differential Transformer (LVDT) sensor technology – a popular and respected form of sensor used throughout the industry as a linear and robust displacement sensor.
The sensors’ robustness stems from the magnet core being positioned away from the detecting coils, making these devices insensitive to involuntary shocks or large displacement. This sensor architecture is also central to the rapid, straightforward exchange of the Dektak stylus.
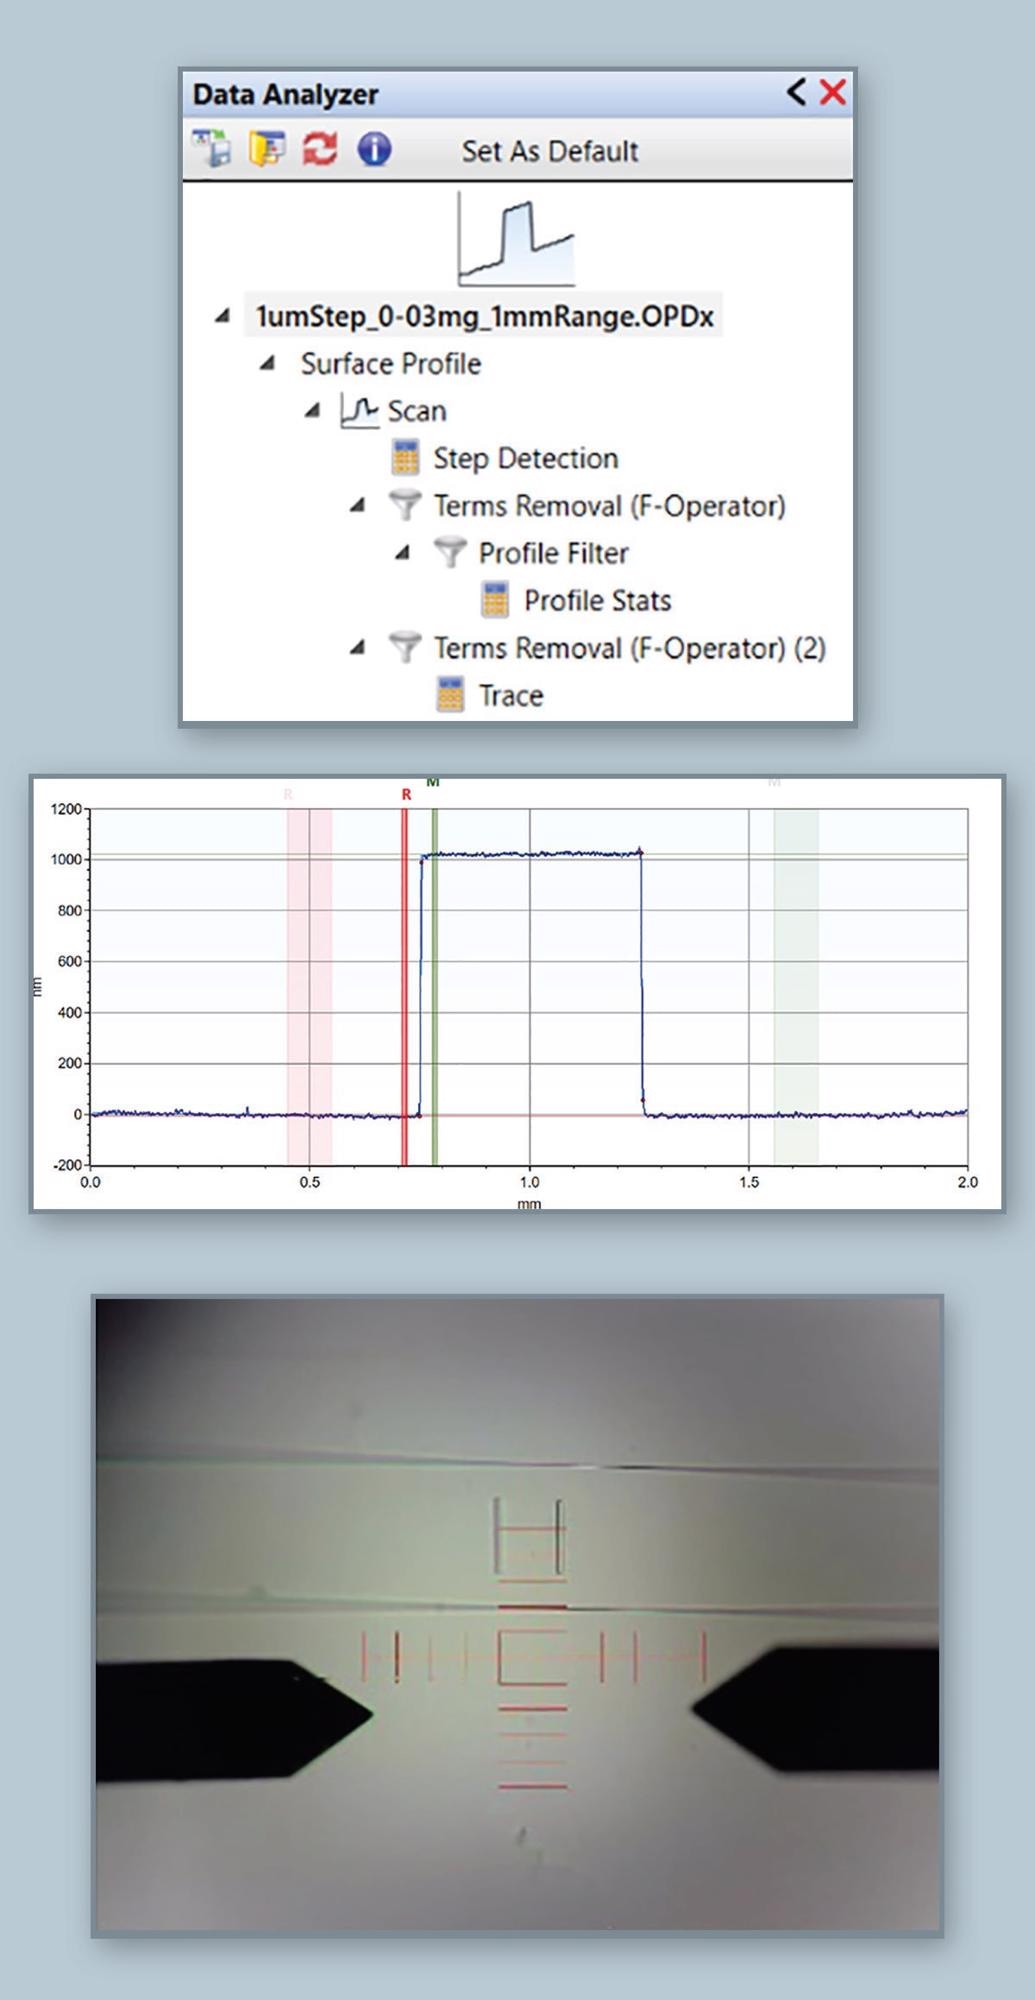
Figure 3. Advanced Analysis setup for automatic step height determination. Multi-tree based Vision64 analysis allows different simultaneous calculations to deliver the best metrology performance and flexibility for a wide range of applications. Image Credit: Bruker Nano Surfaces
The sensor head has also been specifically designed to maintain consistent metrology performance through a wide vertical range (up to 1 mm) and load (from 0.03 mg to 15 mg) while employing a single head.
This extended range allows users to leverage the power of Dektak stylus profilers across a more diverse array of applications.
Influence of Load and Vertical Range
The load applied between the stylus and surface is a key measurement setting for stylus profilers. Not only does this setting assist in the tracking of the surface, but it also enhances measurement precision and sensitivity.
Another important setting - the vertical range - alters both vertical precision and noise via the appropriate application of higher or lower signal amplification.
It is advisable to evaluate the impact of these two parameters versus the ability to perform accurate step height measurements.
This load and vertical range effect are evidenced in Figure 4.
The same certified 1028 nm step height was measured 10 times in the same location, varying load and vertical range between measurements. Vision64’s flexible automation routines ensured that changes were automatically implemented with no operator assistance.
The graphs shown here highlight dispersion through a box representing 2nd and 3rd quartiles, with the extreme bars showing the maximum and minimum. The blue dotted line distinguishes the certification’s uncertainty range, confirming that the exact step value remains comfortably within those boundary limits.
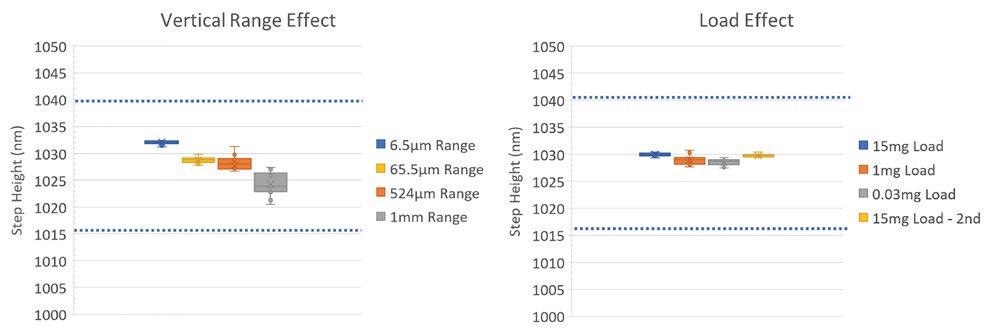
Figure 4. Influence of load and vertical range over 1μm step measurement. The blue dashed lines define the uncertainty range of the calibration sample. Image Credit: Bruker Nano Surfaces
It can be observed that the applied load has no effect on step height measurement and short-term repeatability. This is the case even at the lowest calibrated 0.03 mg load, with one sigma repeatability within a strict (0.5 nm - 0.9 nm) range.
These values showcase the LIS-3 head design’s robustness alongside its excellent, high quality software control.
It should be noted that switching the applied load between lowest and highest had no impact head functionality and that this large load range helped maintain a stable reading of step height, matching the initial applied load.
Vertical range clearly affected repeatability, which becomes worse as range increases. This is an anticipated phenomenon since the measurement signal becomes weaker to account for this larger vertical range.
Despite this, the measured step height is still comfortably within the certified range, meaning that the measurement remains accurate - users obtain accurate results for any given step, regardless of the vertical range and load selected.
Reproducibility
The examples presented in the previous section evaluated short-term repeatability in cases where the sample and stylus remained static, and measurements were recorded consecutively with no interruption.
This is notably different from daily use scenarios where measurements are performed by different operators at different shifts and dates.
Good benchmark metrology systems must ensure stable and consistent measurement over time and through sample load/unload, regardless of variations in users or approach.
To evaluate this, the same 1028 nm step was repeatedly measured during a 2-day period with varying single measurements, multiple successive measurements and different timing.
The automation recipe made use of alignment points to ensure a reproducible start position.
Figure 5 displays step height data presented in chronological order along with the certification limits, which are displayed as blue dotted lines. The results can be observed to be definitively reproducible.
In terms of the normal distribution, 99% of the step height measurements fell within a ±2.8 nm range - <0.03% of the step height. This number seems low, but it does surpass previously recorded repeatability, thus highlighting the impact of an external environmental factor (probably a change in temperature).
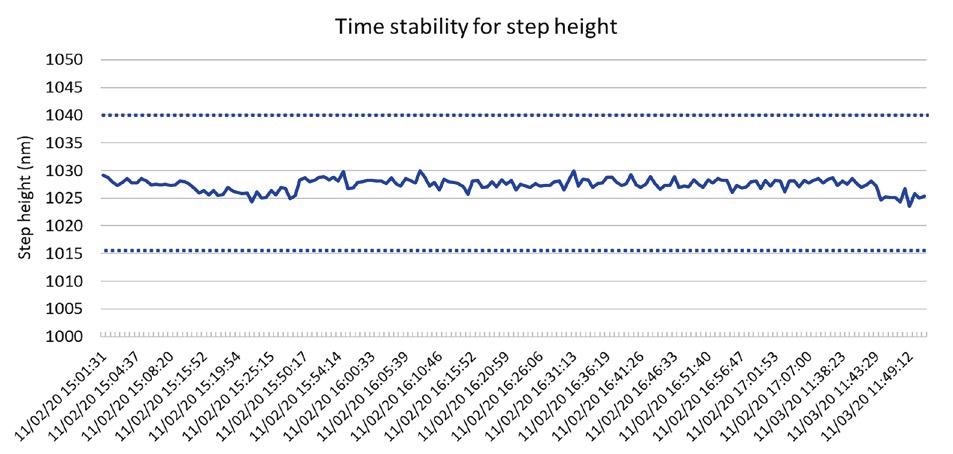
Figure 5. Reproducibility test for 1028nm step over a period of 2 days. Image Credit: Bruker Nano Surfaces
Linearity
Linearity represents a stylus profiler’s metrology capacity to provide an exact step height value along a specific vertical range.
This is a core parameter, because process monitoring typically implies several control points with decreasing or increasing depth or thickness, from which the extracted step height is employed as feedback to adjust process equipment accordingly.
A measurement tool’s linearity directly dictates how tight tolerances in production can be met, making higher Cpk or Cp, and to what degree yield can be improved.
Six calibrated steps were measured within the same analysis recipe. This was done with a fixed 6.5 µm vertical range and constant load to evaluate the inherent linearity performance of Dektak stylus profilometers.
Steps incorporated a vertical range from nanometers (11 nm) to micrometers (1.028 µm) in size, representing the core vertical range for a significant number of common applications. The largest step of 1.028 µm was employed in the range calibration before every measurement.
Figure 6 shows the results of this investigation, clearly showing linear behavior better than 0.1% over 2 decades of vertical range. It should also be noted that the absolute bias versus nominal value never exceeds 2 nm, confirming the measurement’s nanometer-level accuracy.
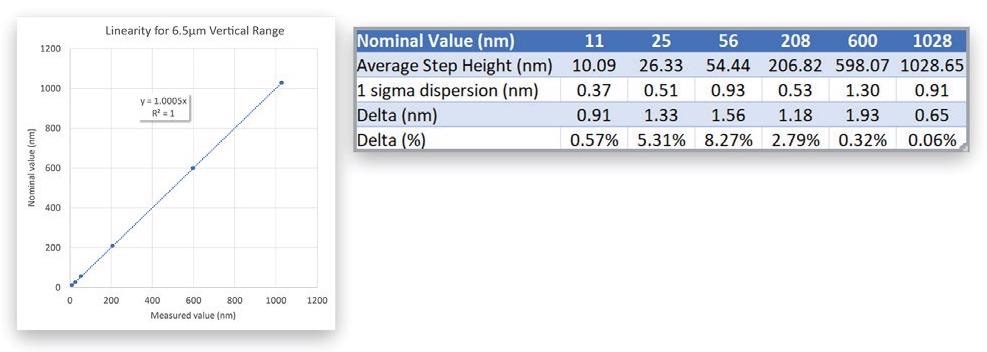
Figure 6. Plot showing linear answer of LVDT sensor over two decades of height (left), and summary tab illustrating accuracy down to the nanometer level (right). Image Credit: Bruker Nano Surfaces
The Dektak LIS-3 LVDT sensor offers an exceptionally linear response across a single measurement range. To measure a wider range of film thickness or etch depth, it is possible to independently calibrate each vertical range to further optimize linearity at a particular range of interest while also maintaining accuracy.
Operation on Soft Surfaces
Since it is a stylus profiling technique, Dektak systems are required to make physical contact with surfaces, thus exerting pressure below the stylus. This can lead to potential surface damage or wear – a bias factor that should be considered due to the modification of the native surface.
This modification risks underestimating the genuine step height.
The LIS-3 sensor has been designed to address this issue and is highly suited to performing measurements on soft materials, for example, those found in polymer coatings, flexible electronics and microfluidic devices.
Multiple measurements were performed to assess this capability. These measurements were done at the same location on a soft, easily scratchable coating that included several organic layers - pressure sensitive adhesive and acrylic dispersion with pigments on silicone paper.
A 2 µm stylus, the ISO standard for roughness and 0.1 mg load were purposefully selected to increase local pressure.
The soft multilayer coating was deposited on a hard glass slide to ensure a consistent baseline before 30 measurements were performed with automatic analysis of average step height.
Measurements were found to exhibit stable readings within ±57 nm over 15.64 µm - less than 0.4% variance (Figure 7).
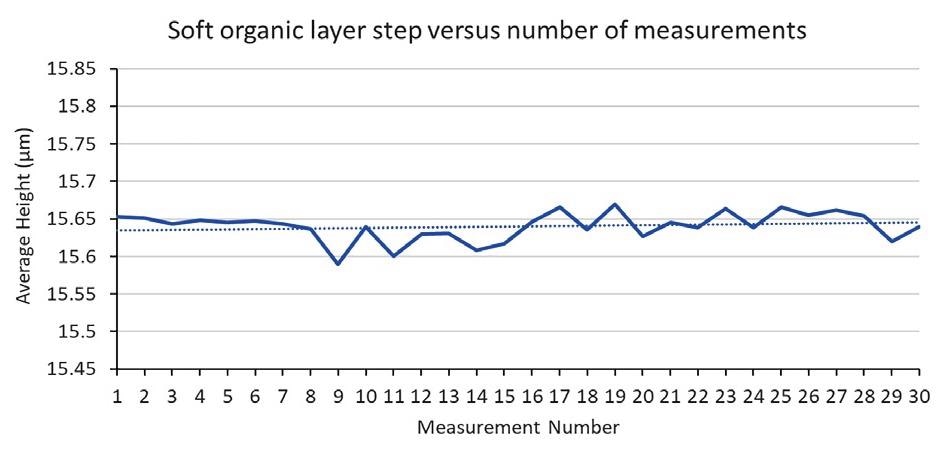
Figure 7. Evolution of measured thickness from a soft organic layer from 30 consecutive measurements. Image Credit: Bruker Nano Surfaces
These results highlight the Dektak stylus profilers’ capacity to measure fragile surfaces. Softer samples can also be measured by employing larger stylus radii (up to 25 µm) alongside a lower load (as low as 0.03 mg) to better reduce risks of surface deformation.
A second example assessment was performed using a PDMS structure typically used for microfluidic devices. This type of sample can be especially challenging to stylus profilers due to its large and abrupt height changes.
These structures were used to test the Dektak’s capacity to apply consistent load and its ability to measure sticky surfaces. Issues stemming from PDMS’ stickiness can only be mitigated via rapid scanning speeds of up to 1 mm/s, but this does require the use of a system with high mechanical bandwidth.
The resulting trace (Figure 8) shows clear indications of appropriate surface tracking, thanks to the low inertia design of the Dektak sensor head.
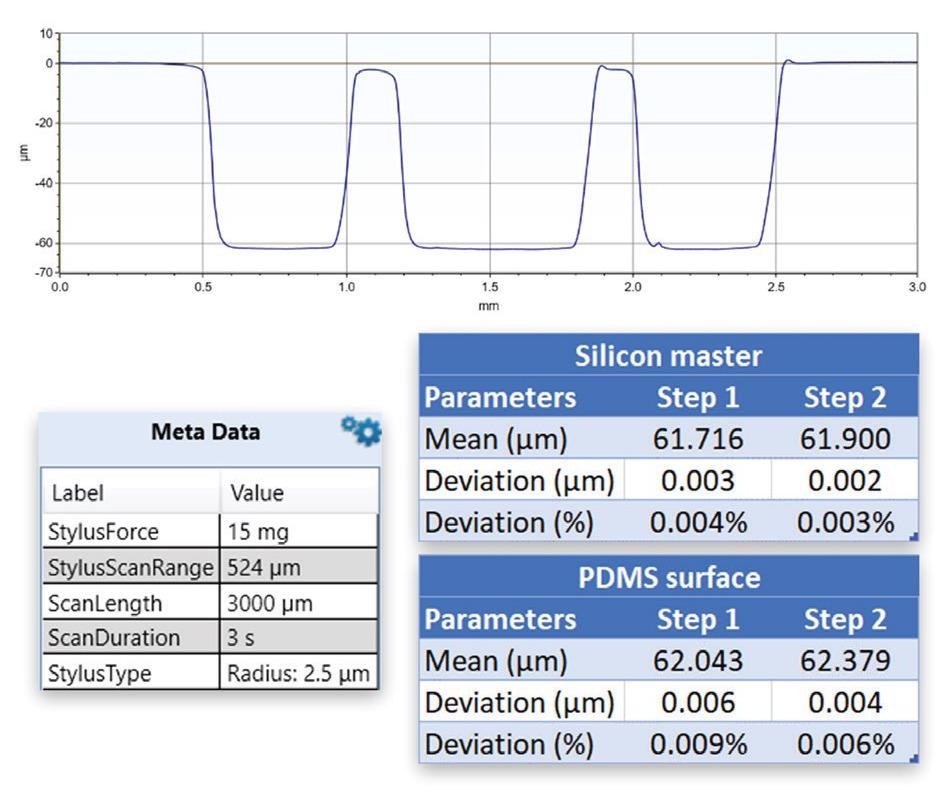
Figure 8. Trace on PDMS microfluidic structure with step results and comparison with silicon stamp master. Image Credit: Bruker Nano Surfaces
The master silicon stamp used to imprint PDMS was also measured to provide a reference point for the measured step height (Figure 8), showing excellent agreement between height differences from PDSM and stamp surfaces with an almost 0.4 µm offset fully consistent with the stamping process.
Each of these case studies provides key insights into the potential of the Dektak stylus profiler in the reliable, accurate and high fidelity measurement of profiles on soft surfaces.
Conclusion
This article has clearly demonstrated Dektak stylus profilers’ capacity to deliver highly accurate and reliable step height measurements down to the nanometer scale.
Dektak systems deliver reproducible results over the full vertical range and applied contact forces, irrespective of application, etch or material deposition, hard or soft matter.
The Dektak LIS-3 sensor head’s low-intertia design allows it to adapt rapidly to abrupt changes in surface morphology while delivering long-term measurement stability and maintaining a high linearity with each vertical range.
Boasting more than 50 years of proven innovation and demonstrable and dependable real-world use, Dektak profilers remain the gold standard for uncompromised stylus profilometry.
These robust, adaptable instruments empower users to achieve consistently better control over production processes, allowing them to meet tighter tolerances and increase yield.
Acknowledgments
Produced from materials originally authored by Samuel Lesko at Bruker.

This information has been sourced, reviewed and adapted from materials provided by Bruker Nano Surfaces.
For more information on this source, please visit Bruker Nano Surfaces.