
Image Credit:Shutterstock/Pedaltothestock
FTIR microspectroscopy facilitates chemical analysis on small sample areas, but samples are not always small - the areas of interest may be small portions of large samples.
It is not always possible or permissible to excise a section of a large sample for analysis. Thus, the non-destructive nature of infrared spectroscopy is deemed to be key when analyzing precious samples that must not be modified.
The Thermo Scientific™ Nicolet™ RaptIR™ FTIR Microscope uses a heavy-duty stage with easy access for loading samples up to 40 mm thick and weighing up to 5 kg. This enables the analysis of a broad range of samples (such as paintings or books) as well as the use of large sampling accessories, including heated and cooled stages or electrochemical cells.
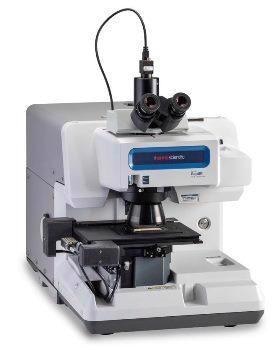
Image: Nicolet RaptIR FTIR Microscope
The Nicolet RaptIR FTIR Microscope also offers a suite of tools for quickly and efficiently identifying the areas of interest on large samples. The combination of simple navigation tools, a wide area overview and extraordinarily sharp and clear images delivers an efficient workflow for high-speed location and analysis of the target area.
To demonstrate the function of this workflow, a 40 mm thick oddly shaped rock weighing 563 g was examined. While the sample was far from the 5 kg stage weight limit of the Nicolet RaptIR FTIR Microscope, it was remarkably heavy for its size (volume = 75 cm3, density = 7.49 g/cm3).
Figure 1 displays the sample mounted on the microscope. Figure 2 exhibits a wide area mosaic collected first. The area at the center of the mosaic was analyzed, as displayed in the higher resolution mosaic shown in Figure 3.
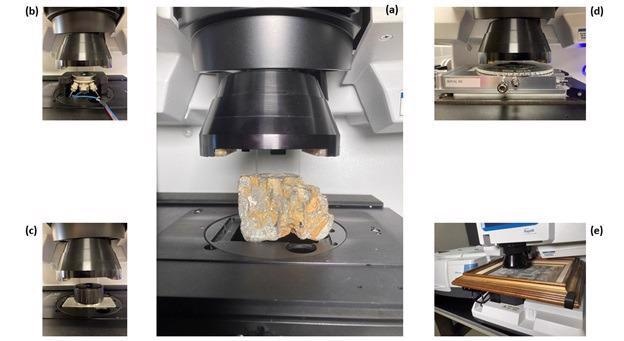
Figure 1. (a) Large mineral sample on the Nicolet RaptIR FTIR Microscope stage with the 15X infrared objective in position, (b) electrochemical cell, (c) inert atmosphere cell, (d) heating / cooling stage, (e) painting. Image Credit: Thermo Fisher Scientific – Materials & Structural Analysis
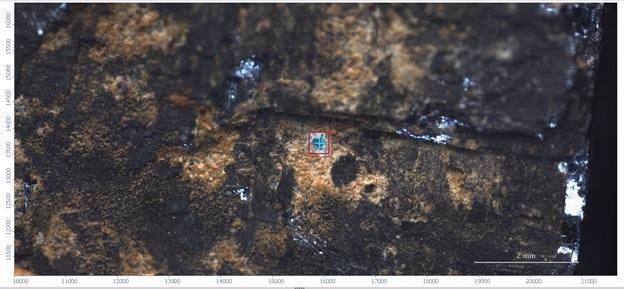
Figure 2. Visual mosaic image of an area on the sample collected with the visual 4X objective. Image Credit: Thermo Fisher Scientific – Materials & Structural Analysis
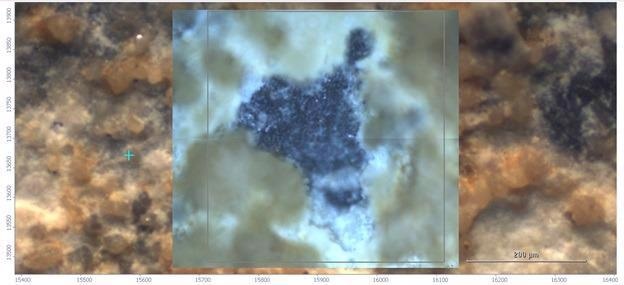
Figure 3. Visual image of the area of interest using the 15X infrared objective. Image Credit: Thermo Fisher Scientific – Materials & Structural Analysis
This mosaic was used to target the infrared analysis. The microscope’s Thermo Scientific™ OMNIC™ Paradigm™ Software allows for the acquisition of several mosaic images and the collection and analysis of a number of regions.
Subsequently, a 400 x 425 mm2 area was analyzed utilizing 25 mm steps and an aperture of 25 x 25 mm2. Infrared images that display various aspects of the spectra are seen in Figure 4. The first infrared image (a) is based on the similarity (correlation) to the infrared spectrum of lead carbonate (PbCO3).
A Kramers-Kronig transformation was used to process the spectra from this region in which the derivative-shaped peaks caused by strong specular reflection were converted into spectra that could be cross-referenced against spectral libraries to establish the component (see Figure 4).
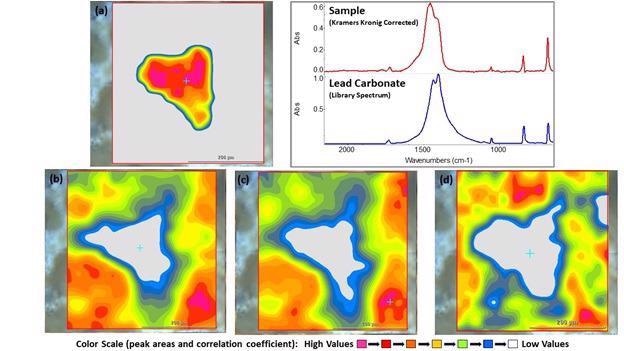
Figure 4. Infrared images of the area of interest and the Kramers-Kronig corrected lead carbonate spectrum and library match. (a) Correlation image based on the spectrum of lead carbonate, (b) Peak area (2700-3000cm-1) image of organic peaks (carbon-hydrogen stretching), (c) Peak area (3350-3750 cm-1) image of hydroxide (oxygen-hydrogen stretching), (d) Peak area (1195-1007 cm-1) image of possible sulfate peak. Image Credit: Thermo Fisher Scientific – Materials & Structural Analysis
The spectra exhibit a combination of organic peaks (C-H stretching), hydroxide peaks (O-H stretching) and what seems to be sulfate (SO42-). Along with the visual appearance and density, these results signify that the rock is primarily composed of galena (PbS).
It is not expected that galena itself has any mid-infrared bands. However, the erosion of galena generates both carbonate and sulfate-containing lead minerals, which are consistent with the analysis. Furthermore, galena and the erosion products are known to absorb and interact with the natural organic materials in soil.
The erosion of galena has been analyzed because, while galena itself is not water-soluble, erosion of the surface can produce elements that release lead ions into the surrounding environment. When absorbed into the body, lead ions are known to be toxic.
This analytical example demonstrates why it is crucial to accommodate larger, heavier samples on an FTIR microscope. It would have been an extremely complex process to cut this sample down to size while maintaining the surface integrity.
In other cases, the actual value of samples might be too high to modify for analysis (such as precious works of art or ancient texts). Therefore, accommodating the analysis of large samples on a microscope can be invaluable, something the Nicolet RaptIR FTIR Microscope is able to achieve effortlessly.

This information has been sourced, reviewed and adapted from materials provided by Thermo Fisher Scientific – Materials & Structural Analysis.
For more information on this source, please visit Thermo Fisher Scientific – Materials & Structural Analysis.