Microscopists often wish – and intuit – that the microstructures that they measure correlate somehow to bulk properties. However, this correlation can be hard to measure.
Machine learning, in particular, deep learning, is an extremely effective tool when attempting to determine the presence (or absence) of such correlations with its capacity to detail trends and relationships that are otherwise hard to establish.
This article outlines the application of deep learning tools, such as convolutional neural nets (CNNs), to evaluate AFM phase and PeakForce QNM® images of impact copolymers (ICPs), a polymer blend of polypropylene with micro-sized domains of rubber.
Firstly, CNNs are employed to effectively classify AFM phase images of an assortment of ICPs, where the rubber morphology and distribution fluctuate.
The model demonstrates that the PeakForce QNM deformation channel offers optimal accuracy in classification. Additionally, a regression-based CNN was used to correlate the AFM images with bulk mechanical properties, where both phase images and the PeakForce QNM deformation channel were separately applied in the model.
The results indicate that the PeakForce QNM data shows superior correlation with the bulk mechanical properties, with high accuracy for anticipating flexural and Young’s modulus, ultimate elongation, and impact toughness.
Machine Learning and AFM
Machine learning (ML), a subdivision of artificial intelligence, is becoming increasingly prevalent in a huge range of sectors, including healthcare, transportation, drug and materials design.
The same is true for the microscopy world, as these new tools are helping improve image analysis and interpretation, as well as microscope operation.
An example of ML tools application to microscopy is the utilization of deep learning (DL) tools for atom localization and segmentation, deblurring of STEM images and noise reduction.1
Another instance is DL for high-resolution fluorescence super-resolution microscopy to generate a model that has the ability enhance low-resolution, low-SNR data.2
A less common application has been determining structure-property relationships, though a group of researchers led by T. Young-Jin Han did apply ML techniques and computer vision to predict compressive strength using SEM images.3
The application of ML using scanning probe microscopy has been more limited, in part due to the slow acquisition throughput that hinders the building of the big datasets generally needed for efficient ML models.
Some notable exceptions include the use of ML to facilitate rapid scanning probe microscopy with piezoresponse force microscopy,4 and in the analysis of surface parameters of AFM images of bladder cells.5
For this article, two kinds of AFM data were investigated to determine their capacity to predict bulk material properties: phase data that addresses a material's morphology; and PeakForce QNM data, which offers both morphology and quantitative contrast of the mechanical properties of a material, including adhesion, dissipation, and modulus.
The material being investigated was an ICP, a common polymer blend utilized in a number of consumer applications that desire both stiffness and impact toughness. Firstly, ML models were developed for the ICP classification based solely on its AFM image.
Next, more complex models based on the AFM image were assembled to predict a range of bulk mechanical properties of the ICPs.
Because of its ability to collect more quantitative mechanical property information, the PeakForce QNM data offered better prediction and classification of the ICPs.
Experimental
All of the ICP samples were cryomicrotomed with a specimen for every sample.
Phase Imaging
Phase images were acquired across a sequence of five ICP samples (A2, B3, B4, C3 and C5). A total of eighty images on each sample were captured with the use of a Bruker MultiMode® AFM and a range of stiff probes (k~40N/m) across different days.
Only completely net-repulsive images without significant cutting marks were included in the study. All the phase images were captured at a 2 Hz scan rate on a 10 μm x 10 μm length scale.
PeakForce QNM Imaging
PeakForce QNM images were captured across nine ICP samples (A2, B1, B2, B3, B4, B5, C3, C5 and E4) using a Bruker Icon® AFM.
Since PeakForce QNM images typically take more time to acquire than phase images, automation was used to increase the duty cycle of the data acquisition.
Using AutoMET® software to program automatic imaging routine for three polymer samples, followed by a tip-characterization sample. On each of the polymer samples, five scans were captured at a 4 µm scan size and with a scan rate of 1 to 1.5 Hz.
For each of the 15 polymer sample images, the tip characterization sample was imaged once using ScanAsyst® and a 2.5 µm scan size with a 2:1 aspect ratio.
Around forty-five images were acquired on each of the nine samples. For all measurements, an RTESPA 150-30 probe with a nominal 5 N/m spring constant and 30 nm probe radius was applied.
It should be noted that this probe was selected due to its optimization for quantifying rubber properties in the ICP, but it is not well-suited for the measurement of the polypropylene characteristics. A total of three probes were used to capture all the images in this particular study.
Tip characterization sample analysis was performed using Bruker software and the tip-qualification feature. This analysis demonstrated that for probes with an initial radius of 30 nm, there was little change to the tip diameter over the full set of measurements, with changes of only 2 nm or less in either direction recorded.
To preprocess the AFM images, phase scale was normalized so that absolute phase degrees information was removed, thus only capturing the relative phase difference between the two components.
For the PeakForce QNM data, the deformation and dissipation channels were used without additional processing. There was some noise detected in the DMT modulus channel, which was subsequently removed before being used as an input to the DL model.
Machine Learning
CNNs are commonly used for image classification. CNNs with residual network architectures were employed to construct both regression and classification problems. Suitable activation functions were applied in the final layers of the classification and regression models in order to calculate a class and a value, respectively.
The series of images captured from AFM were separated at random into 80% training data and 20% as a test set to assess the DL model. The data size was relatively low for training purposes.
To boost the training set by five-fold, data augmentation methods were employed. A set of five images was generated from each image by rotating it 90 degrees, 180 degrees, and 270 degrees, and flipping it upside down.
A 50-layer-deep residual network (ResNet) was trained to assemble a classification model. A Tensorflow6 module with a Keras backend was employed to train all models. The DL model structures were identical for the phase and the PeakForce QNM data. Either phase data or PeakForce QNM data sets were used to train the models.
While the models were trained to predict the material properties, they were separately trained for each of the properties, which generated separate models for predicting different properties. Confusion matrices are a powerful tool to assess the accuracy of machine learning to classify test data.
In a confusion matrix, the horizontal axis shows the true label, while the ML model’s predicted label is displayed on the vertical axis. The optimum analysis would result in non-zero elements across the diagonal and all zero off-diagonal elements signaling a 100% accuracy of the model’s capacity to correctly classify test data.
The models were then assessed on the hold-out test data set. The classification models were reviewed based on the overall accuracy of prediction, and additional prediction details were displayed on a confusion matrix.
An R2 score was employed for evaluation of the regression models: An R2 score measures improvement or deterioration in the performance of the model performance compared to a baseline prediction of the mean of possible outcomes as the prediction every time.
An R2 score of 1.0 indicates perfect predictions, so The closer the R2 score is to 1.0 (which indicates a perfect prediction) the better the model performance is.
The R2 score is a suitable measure to evaluate model performance when outcomes (numeric values) are near each other in the predictive models (which was the case for the correlation model for predicting material properties).
Results
A phase image representative of an impact copolymer (ICP) is displayed in Figure 1a.
There are three components that make up ICP material: the yellow background PP matrix, the dark brown domains of ethylene-propylene rubber, and the lighter ethylene inclusions within the rubber domains.
There are many variations between the different ICPs investigated for this study, including density, distribution, rubber domain/inclusion size and the quantitative mechanical measurements on the rubber domains.
Figure 1b is an evaluation of the PeakForce QNM modulus data from samples A2, C3 and C5, and shows a considerable difference in the DMT moduli between the rubbers in these three ICP samples, where A2 demonstrates the lowest value (33 MPa) and C5 is almost 4x higher (130 MPa).
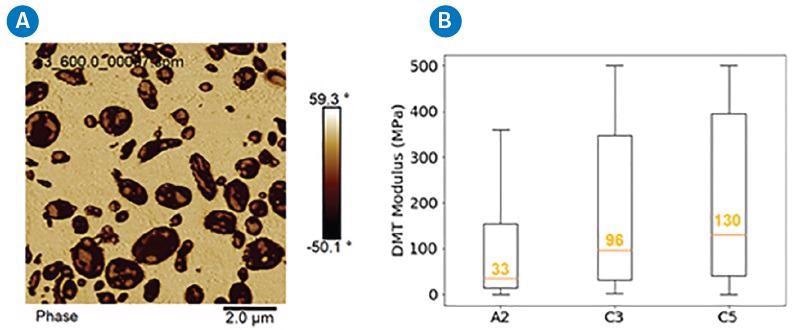
Figure 1. A) Representative image of an ICP, and B) distribution of DMT modulus of rubber domains in 3 ICPs (A2, C3, C5). Image Credit: Bruker Nano Surfaces
This quantitative mechanical information is only accessible via an AFM-based technique, such as PeakForce QNM, and can considerably improve the accuracy of ML models for the classification and prediction of bulk properties.
Classification
The ML models’ capability to classify the different ICPs was assessed, with results displayed in confusion matrices (Figures 2 and 3).
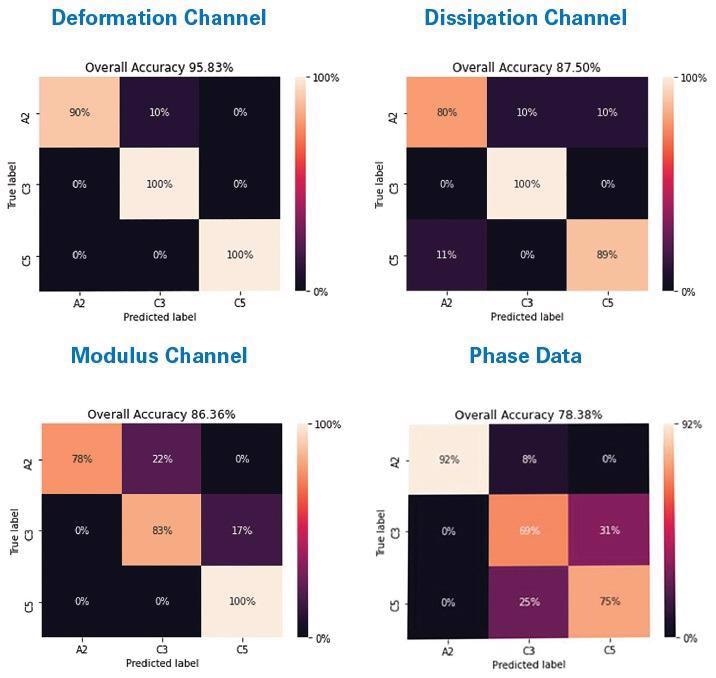
Figure 2. Confusion matrices showing results of a CNN classifying three ICPs (A2, C3, C5) using AFM data: PeakForce QNM deformation, PeakForce QNM dissipation, DMT modulus, and phase. Image Credit: Bruker Nano Surfaces
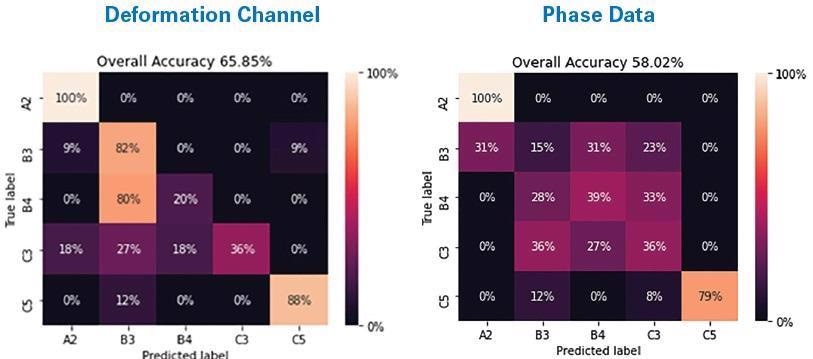
Figure 3. Confusion matrices showing results of a CNN on a five-way classification of five ICPs (A2, B3, B4, C3, C5) using the PeakForce QNM deformation channel and phase data. Image Credit: Bruker Nano Surfaces
First, the various AFM channels show the capacity to accurately classify different materials, as shown in Figure 2, where a comparison of all phase data, the PeakForce QNM deformation channel, the PeakForce QNM dissipation channel, and the PeakForce QNM DMT modulus channel is performed for three samples (A2, C3 and C5).
The ML model predicated on the PeakForce QNM deformation channel offered the best accuracy at 95.8%, closely followed by the dissipation channel (87.5%) and DMT modulus channel accuracy (86.4%), with the phase data demonstrating the lowest accuracy (78.4%).
The model was subsequently trained on a larger sample set made up of five samples, including B3 and B4, which were difficult to differentiate by eye.
Models based on phase data and PeakForce QNM deformation data are contrasted in Figure 3 for this larger sample set. The ML model predicated on deformation data classified the five ICPs 65.8% of the time with great accuracy, while the phase data demonstrated accuracy for 58% of the test data.
Bulk Property Prediction
Models predicated on phase data and PeakForce QNM deformation data were constructed and trained to predict the bulk mechanical properties of notched izod, flexural modulus, Young’s modulus and ultimate elongation.
The DL’s prediction on test data for five samples (A2, B3, B4, C3 and C5) is displayed in Figure 4, where the purple bars indicate bulk property, the green bars show prediction from a model based on PeakForce QNM data, and the orange bars represent the prediction from a model based on phase data.
As previously described, the R2 score is employed to quantify the model’s prediction accuracy for an individual property.
Figure 4e shows that, for all the bulk properties, the R2 score for models based on the deformation channel was greater than that of the phase data.
The ultimate elongation (figure 4c) and Young’s modulus (figure 4d) had the best accuracy (both kinds of models), with notched izod (figure 4b) showing the least accuracy for both the PeakForce QNM and phase data.
The general tendency in prediction is similar between phase and PeakForce QNM data, with the latter typically demonstrating better performance.
Considering that the PeakForce QNM deformation channel delivered superior accuracy, an ML model based on deformation was trained and tested on a larger set of nine ICP samples (A2, B1, B2, B3, B4, B5, C3, C5 and E4).
The ML model’s capability to predict a sequence of five mechanical properties – flexural modulus, notched izod, Young’s modulus, ultimate elongation and yield strength – are shown in figure 5.
A model to predict yield strength is included in this larger set as it offered a broad enough spectrum for the yield strength value.
The ML model is only appropriate when there is a wide range in the property it is attempting to predict.
In this larger sample set, the flex modulus and yield strength demonstrated the superior capabilities of the ML model to predict the bulk property. Like the results shown in Figure 4, the notched izod was predicted with the lowest accuracy among all the material properties.
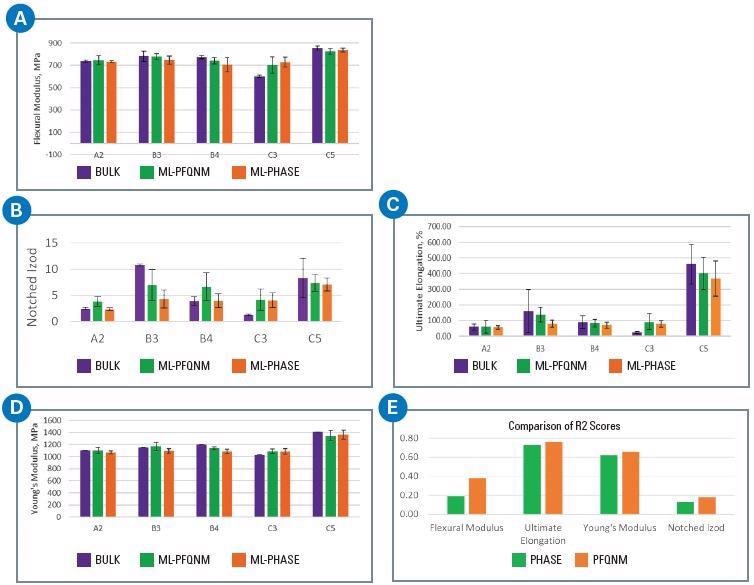
Figure 4. Results of a regression-based CNN for a five-sample ICP set to predict various bulk mechanical properties: A) flexural modulus, B) notched izod, C) ultimate elongation, D) Young’s modulus, E) comparison of R2 scores for the ML-phase and ML-PFQNM models for the various bulk properties. Image Credit: Bruker Nano Surfaces
Discussion
There are a number of reasons why the deformation channel was the best performing among all the available AFM data. All the AFM data (phase and PeakForce QNM) offer morphological information on the rubbers and their inclusions: their distribution, density and size.
However, The PeakForce QNM data offers additional quantitative mechanical data as well, whether it is the deformation of the cantilever into the rubber (that is related to its modulus), the DMT modulus of the rubber, or the dissipation channel that correlates with the energy dissipated by the cantilever into the material.
Among the PeakForce QNM channels, the deformation channel offers a few unique benefits. Firstly, it is the cleanest channel in respect of spurious noise relative to the dissipation and DMT modulus.
Also, the deformation channel is less susceptible to adhesion than other channels, such as the dissipation channel, where small variations in tip chemistry could influence the measurement.
Lastly, the deformation channel is directly measured from the force curve on the approach. Whereas, the dissipation channel is measured between the approach and retract, and the DMT modulus is measured on the retract.
Furthermore, there is an increase in DMT modulus error and noise if the shift in deflection nears the change in Z position or if there is a viscoelastic component to the deformation.
All these factors contribute to the deformation channel delivering the best results for the ML model’s ability to classify and predict the bulk properties of the various ICPs.
In this study, the bulk mechanical properties predicted measure the various elastic and plastic properties. Ultimate elongation is a plastic property that measures the percentage increase in length of a material before breaking under tension.
Yield strength sits at the border of elastic-plastic behavior and is the measured stress at the onset of plastic deformation. The notched Izod test measures impact toughness, a plastic property.
Finally, Young’s modulus and flexural modulus are completely elastic properties. The flexural modulus and Young’s modulus are well predicted by the regression-based ML model (see Figure 5), indicating that microstructure and quantitative deformation are related to these properties.
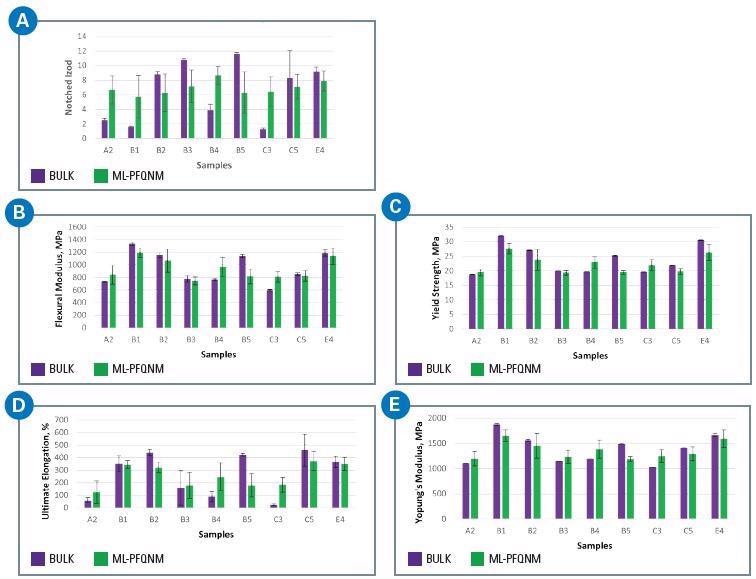
Figure 5. Results of a regression-based CNN for a nine-sample ICP set to predict various bulk mechanical properties: A) notched izod, B) flexural modulus, C) yield strength, D) ultimate elongation, E) Young’s modulus. Image Credit: Bruker Nano Surfaces
This comes as no surprise since the deformation is directly related to the modulus of the material, albeit being measured on the nanoscale in the PeakForce QNM channel.
Conversely, the models did not accurately predict the impact toughness of the material as measured by the notched izod, indicating that the same information – at least on this 4 µm length scale – was insufficient for this property.
This opens the door to many other possibilities that can be further investigated to enhance the prediction of impact toughness, such as bringing together different PeakForce QNM channels, gathering data on different length scales, and collecting quantitative mechanical measurements on the PP matrix, which would necessitate repeating the measurements with a cantilever using a different spring constant that is better suited to the stiffer PP.
Concluding Remarks
DL models based on various types of AFM data can be successfully applied to classify ICP materials and predict their bulk mechanical properties.
Both AFM phase data and PeakForce QNM data (DMT modulus, dissipation and deformation) were employed to construct CNNs to conduct this analysis.
The deformation channel offered superior accuracy for the classification measurements on test ICP data for a sequence of five samples.
In line with these results, CNNs assembled on AFM deformation data anticipated the Young’s modulus, flexural modulus, yield strength, notched izod and ultimate elongation of a larger set of nine ICP samples.
The most accurate predictions observed were related to yield strength, flexural modulus and Young’s modulus.
Future predictions for additional properties can be improved by exploring various length scales, adding additional PeakForce QNM data channels beyond deformation and acquiring quantitative measurements on the polypropylene matrix material.
References
- R.Z. Ruoqian Lin, Chunyang Wang, Xiao-Qing Yang, and Huolin L. Xin. “TEMImageNet training library and AtomSegNet deep-learning models for high-precision atom segmentation, localization, denoising, and deblurring of atomic-resolution images.” Scientific Reports 2021, 11, 5386.
- F.M. Linjing Fang, Sammy Weiser Novak, Lyndsey Kirk, Cara R. Schiavon, Seungyoon B. Yu, Tong Zhang, Melissa Wu, Kyle Kastner, Alaa Abdel Latif, Zijun Lin, Andrew Shaw, Yoshiyuki Kubota, John Mendenhall, Zhao Zhang, Gulcin Pekkurnaz, Kristen Harris, Jeremy Howard, and Uri Manor. “Deep learning-based point-scanning super-resolution imaging.” Nature Methods 2021, 18, 406.
- M.R. Brian Gallagher, Donald Loveland, T. Nathan Mundhenk, Brock Beauchamp, Emily Robertson, Golam G. Jaman, Anna M. Hiszpanski, and T. Yong-Jin Han. “Predicting Compressive Strength of Consolidated Molecular Solids Using Computer Vision and Deep Learning.” Materials & Design 2020, 190, 108541.
- K.P. Kelley; M. Ziatdinov, L. Collins, M.A. Susner, R.K. Vasudevan, N. Balke, S.V. Kalinin, and S. Jesse. “Fast Scanning Probe Microscopy via Machine Learning: Non‐Rectangular Scans with Compressed Sensing and Gaussian Process Optimization.” Small 2020.
- I. Sokolov, M.E. Dokukin, V. Kalaparthi, M. Miljkovic, A. Wang, J.D. Seigne, P. Grivas, and E. Demidenko. “Noninvasive diagnostic imaging using machine-learning analysis of nanoresolution images of cell surfaces: Detection of bladder cancer.” PNAS 2018, 115, 12920.
- M. Abadi, et.al. “Tensorflow: A system for large-scale machine learning.” Symposium on Operating Systems Design and Implementation 2016, 265-283.

This information has been sourced, reviewed and adapted from materials provided by Bruker Nano Surfaces, based on work originally performed by Dalia Yablon (SurfaceChar LLC, Sharon MA); Ishita Chakraborty (Stress Engineering Services, Houston, TX); Hillary Passino, Krishnan Iyer, Antonios Doufas, and Maksim Shivokhin (ExxonMobil Chemical Company, Baytown TX); and Bede Pittenger and John Thornton (Bruker Nano Surfaces and Metrology, Santa Barbara, CA).
For more information on this source, please visit Bruker Nano Surfaces.