Sponsored by EDAXJan 31 2023Reviewed by Olivia Frost
Determining whether a boundary path in a structure follows grain boundaries or has a transgranular component is not always clear through a standard Scanning Electron Microscope (SEM) micrograph.
Orientation Imaging Microscopy (OIM™) possesses the unique ability to differentiate grains based on crystallographic orientation rather than relying on etching or other contrast enhancement techniques. This enhanced capability of OIM allows for an unmistakable identification of whether a specific crack segment is transgranular or intergranular.
Moreover, the crack path is particularly conspicuous in Image Quality (IQ) maps. This is because the diffraction patterns in the crack are usually non-existent or, at best, very weak.
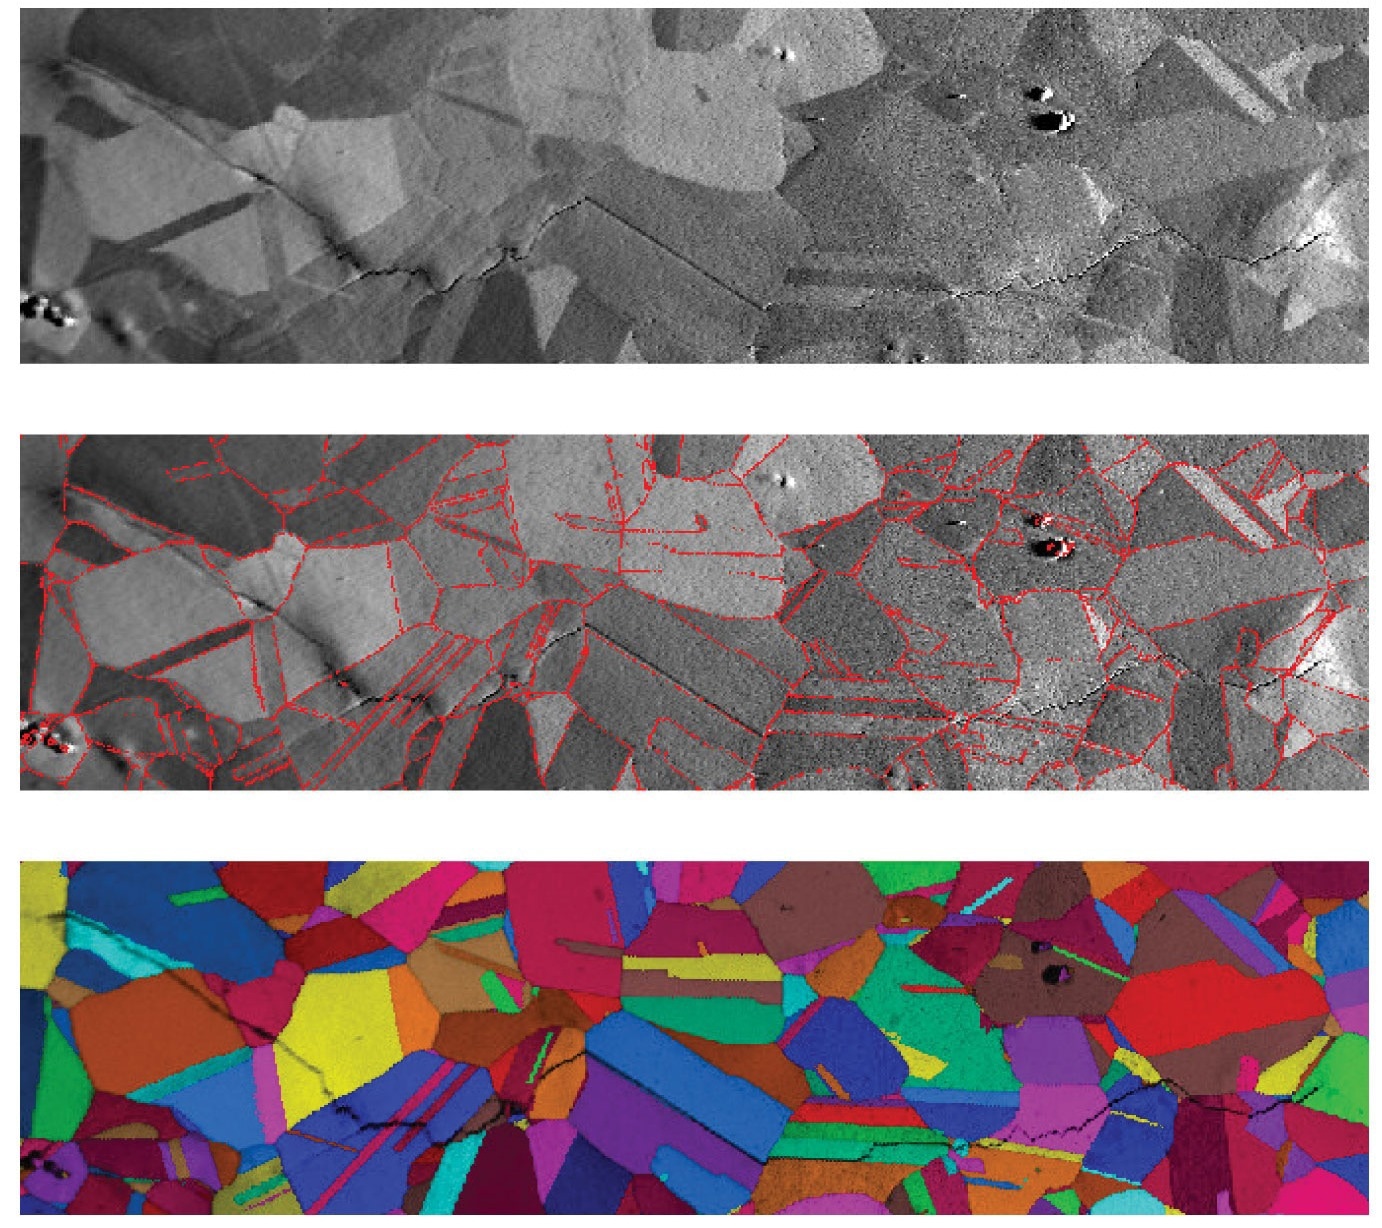
Figure 1. Image from the Secondary Electron Detector (SED) of a fatigue crack in a nickel superalloy (top). SED image overlaid with grain boundaries as determined by OIM (middle). Grains as determined by OIM delineated by random colors overlaid on a gray scale map based on a parameter describing the Image Quality (IQ) of the individual diffraction patterns (bottom). Image Credit: EDAX.
Grain Boundary Distributions
When studying cracks that propagate along grain boundaries, it can be beneficial to determine if the cracked boundaries share a specific characteristic in comparison to the overall distribution of boundaries.
For instance, as shown in Figure 2, in the case of copper interconnect lines undergoing thermal stress, misorientations were measured across both the voided and unvoided grain boundaries using OIM. The two distributions demonstrate that low-angle boundaries are less likely to form voids.
There is a peak in the distribution of voided boundaries at 52°, indicating that these boundaries are more prone to void formation. This analysis has also been applied to fractures in lead-free solder alloys.
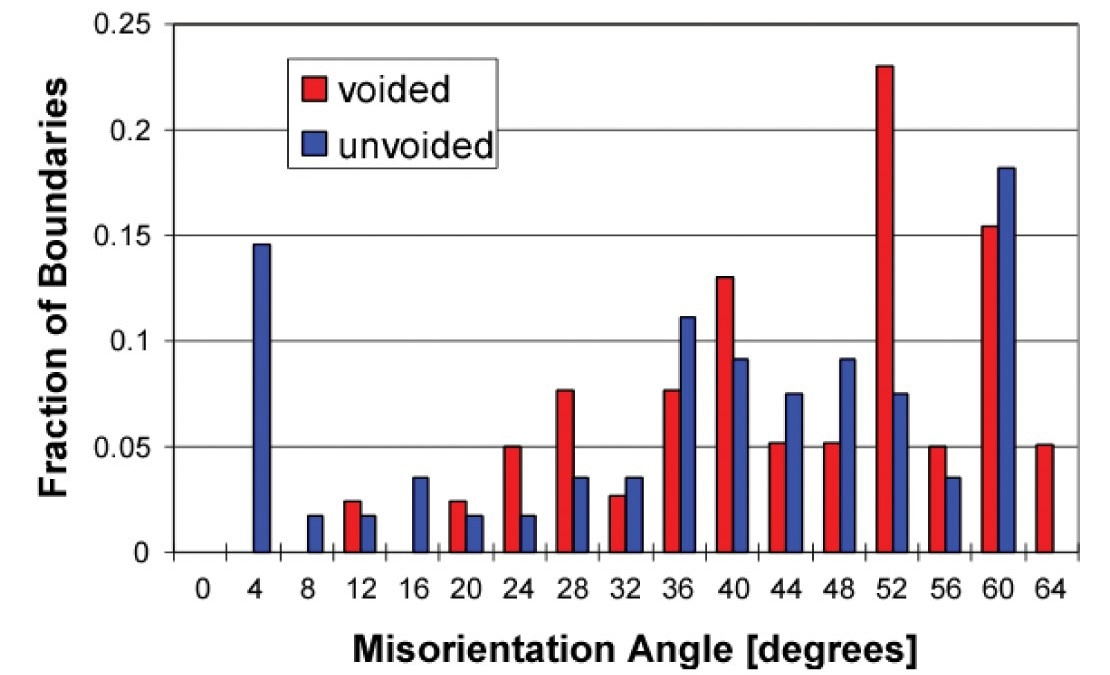
Figure 2. Distribution of voided and unvoided grain boundaries in copper interconnect lines. Nucci, J. A., R. R. Keller, D. P. Field and Y. Shacham- Diamand (1997). "Grain boundary misorientation angles and stress-induced voiding in oxide passivated copper interconnects." Applied Physics Letters 70: 1242-1244. Image Credit: EDAX.
Taylor Factor Mapping
OIM can be utilized for an even more intricate analysis of the microstructure. One example of this is the construction of a Taylor factor map. The Taylor factor is a measure that predicts the yield response of grain concerning the stress state and grain orientation. As seen in Figure 3, grains colored blue tend to have a relatively easy slip, while grains shaded red tend to be resistant to yielding.
Boundaries separating grains with a significant mismatch in the Taylor factor may be more prone to intergranular fracture. Conversely, grains with high Taylor factors will be less likely to yield and may be more susceptible to transgranular fracture. The crack path in Figure 3 appears to indicate that the path is intergranular, where there is a significant mismatch in the Taylor factor.
Accurately identifying the stress state is challenging when applying such analysis to lead-free solders. In this example, the stress state is uniaxial tension in the horizontal direction, aligned with the experimental testing axis.
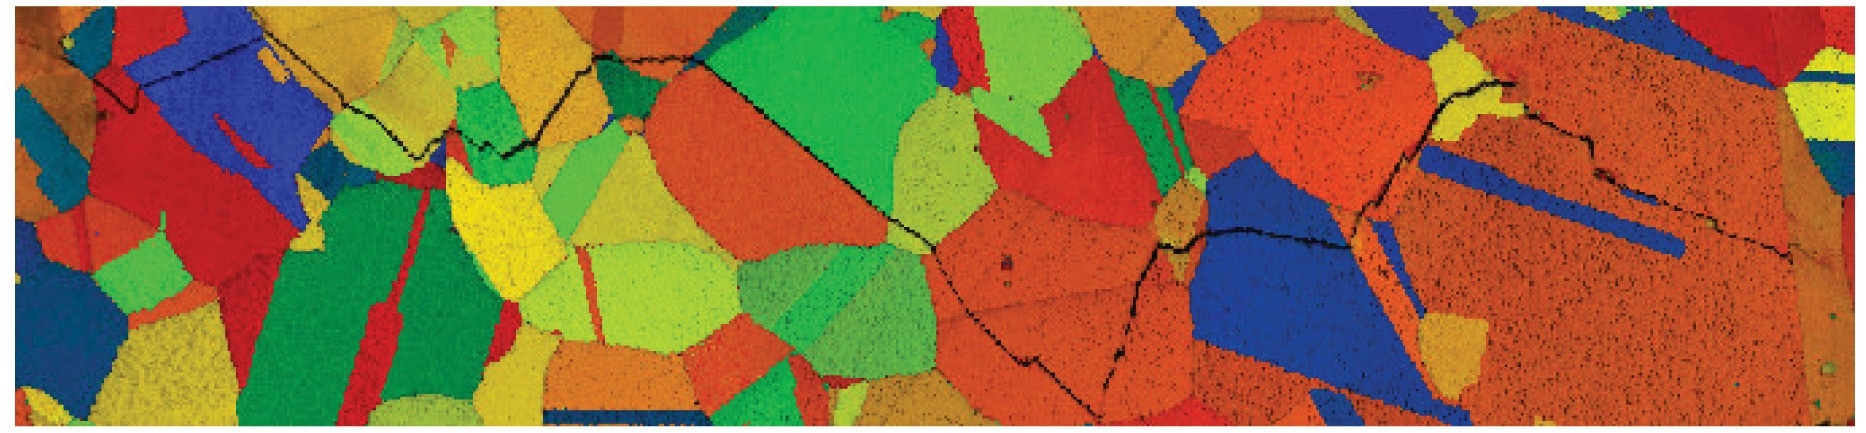
Figure 3. Taylor factor map overlaid on an IQ map. The map area contains a fatigue crack in a nickel superalloy. Image Credit: EDAX.
Local Orientation Variations
The presence of local orientation variations, which can be observed through OIM, can influence crack propagation. These variations, often indicative of accumulated residual strain in the material, may be areas where crack initiation is more likely to occur.
As demonstrated in Figure 4, a fatigue crack tip in a nickel alloy exhibits substantial local orientation variations. These variations within individual grains can be as high as 60°. OIM is particularly well-suited for investigating these local orientation gradients due to its high angular resolution.
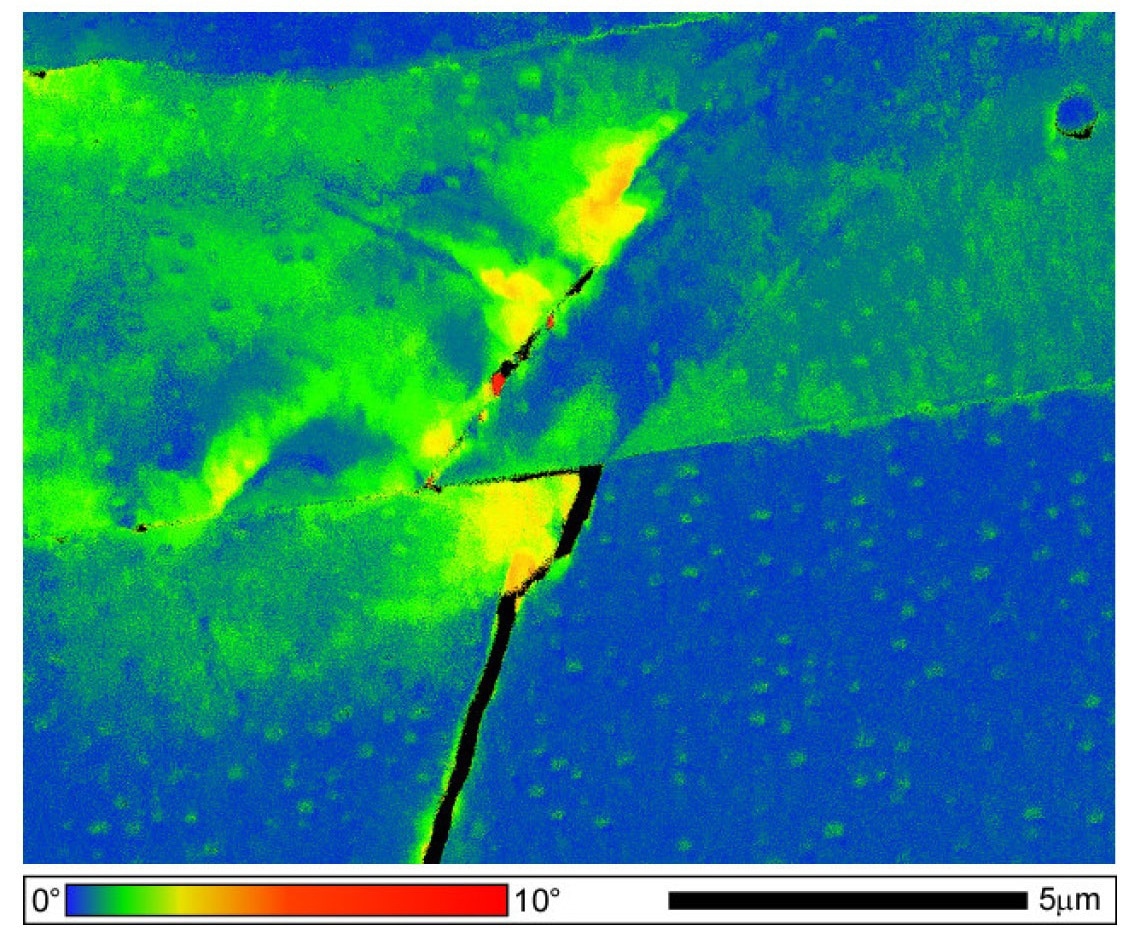
Figure 4. Local misorientation map near a crack tip in steel. The small ovals are associated with second phase particles. Image Credit: EDAX.
Note
It is essential to keep in mind that the OIM results illustrated here are all conducted on two-dimensional planar surfaces. While cracking is a three-dimensional occurrence, to obtain a comprehensive understanding of crack propagation and the strain fields surrounding a crack tip, three-dimensional analyses would need to be performed.
Conclusion
Since cracking often appears to propagate along specific crystallographic planes in crystalline materials, OIM is well-suited for investigating the various aspects of cracking.

This information has been sourced, reviewed and adapted from materials provided by EDAX.
For more information on this source, please visit EDAX.