Active pharmaceutical ingredients (APIs) are typically produced through crystallization. In this process, an organic molecule can take on multiple crystalline forms.
Solid-state characteristics, including morphology and particle size distribution, play a crucial role. However, the presence of various physical forms such as polymorphs, solvates, cocrystals, or amorphous states in APIs, if not controlled, can significantly impact material performance during processing, manufacturing storage, and drug administration.
For example, the solubility of different polymorphs of the same API can vary by up to fourfold.
Crystallization screening involves assessing methods, reagents, and other chemical and physical factors to identify their positive or negative associations with sample crystallization.
In the initial stages of development, only a limited amount, often just a few hundred milligrams, of the compound may be available for solid-form screening. In such cases, small-scale, high-throughput approaches using multi-well plates can prove highly beneficial.
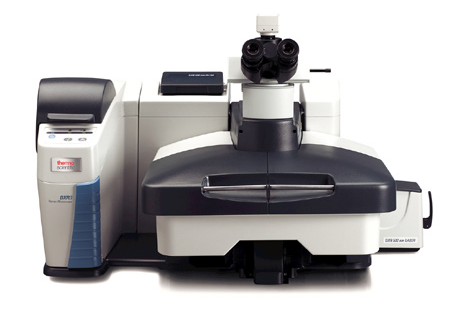
Thermo Scientific DXR3 Raman Microscope. Image Credit: Thermo Fisher Scientific – Materials & Structural Analysis
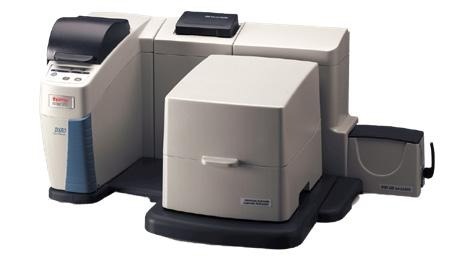
Thermo Scientific DXR3 SmartRaman Spectrometer. Image Credit: Thermo Fisher Scientific – Materials & Structural Analysis
Analysis and Characterization of Solid Forms
No matter how the crystallized API samples are generated, the next step involves identifying the forms produced. Various analytical techniques are employed to definitively identify new polymorphs or mixtures of solid forms.
Additionally, several methods can differentiate between different crystalline or amorphous API forms, with Raman spectroscopy and Raman microscopy being particularly useful.
When crystallization is carried out using high-throughput methods, a small amount of recrystallized material is unevenly distributed on the base or vessel walls. Locating crystal positions within each well can sometimes be a challenge.
However, the Thermo Scientific™ DXR3 SmartRaman Spectrometer and Thermo Scientific™ DXR3 Raman Microscope with OMNIC™ Array Automation Software make it easy to pinpoint non-uniformly distributed particles on the base.
In cases involving metastable polymers that may rapidly transition into other forms, analysis speed is crucial.
Raman spectroscopy and microscopy offer an advantage as crystallized samples in Kapton well plates can be directly transferred to the DXR3 Raman Microscope stage or the DXR3 SmartRaman Spectrometer sampling accessory for analysis. This ensures direct sample measurement while reducing the risk of sample damage.
The figure below displays the spectrum of an API obtained through a Kapton well plate and the spectrum of an empty well plate. The clear lack of overlap between the two spectra demonstrates that all the spectral features of the API (blue) are observable even when measuring through the well plate (red).
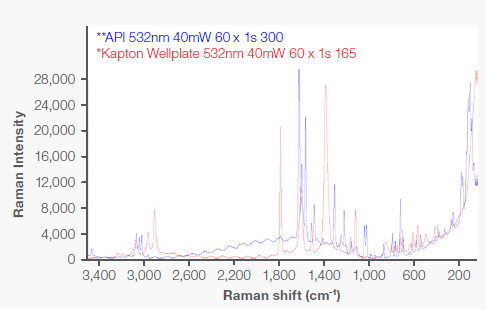
Figure 1. Spectrum of an API (blue) overlaid with spectrum of a Kapton well plate (red). Image Credit: Thermo Fisher Scientific – Materials & Structural Analysis
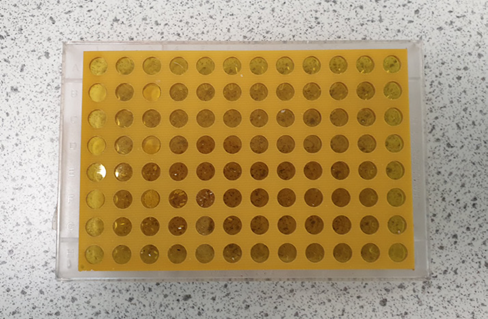
Figure 2. Kapton Plate. Image Credit: Thermo Fisher Scientific – Materials & Structural Analysis
When selecting Raman for high-throughput automated polymorph screening, there are several crucial factors to take into account, including:
- Sampling accessories—12-, 96-, 384-, and 1536-well formats.
- Ability to measure at multiple locations within the base of the well plate.
- Ability to measure through Kapton and other well plates without sampling.
- Automated data collection, analysis, and two-way communication with LIMS.
- Compatibility with sampling robots.
In the article, the authors demonstrate the workflow for high-throughput polymorph screening using the DXR3 Smart Raman instrument. Titanium dioxide (TiO₂) presents four common polymorphs: anatase, rutile, brookite, and TiO₂-B.
To illustrate the automated workflow, the researchers specifically selected anatase and rutile polymorphs. In Figure 3 below, the Raman spectra of anatase, rutile, and a blank well, which is composed of polystyrene, are observable.
The spectral characteristics that assist in distinguishing the particular polymorph or form are evident and remain unobscured even when measured through a polystyrene well plate.
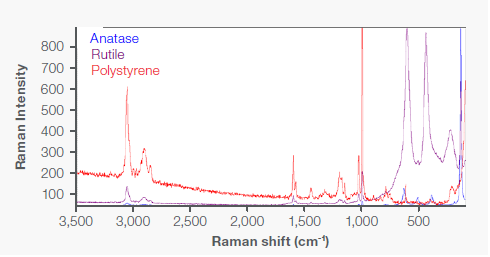
Figure 3. Raman spectra of anatase (blue), rutile (purple), and polystyrene (red). Image Credit: Thermo Fisher Scientific – Materials & Structural Analysis
Upon applying the Savitzky-Golay derivative to the spectra of rutile and anatase TiO₂, notable distinctions become apparent in the spectra within the wavenumber range of 904-82 cm⁻¹.
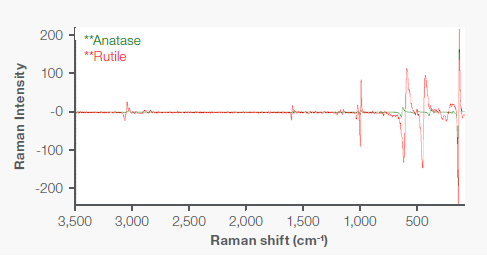
Figure 4. Savitzky-Golay derivative applied to the spectra of rutile (red) and anatase (green) TiO₂. Image Credit: Thermo Fisher Scientific – Materials & Structural Analysis
The preprocessed spectra can then be utilized for cluster analysis. Hierarchical cluster analysis is a method that objectively groups the spectra based on their similarities in properties, specifically their spectral features.
In this case, cluster analysis is applied to the spectra obtained from samples in a 96-well plate. After the analysis, the well plates are color-coded, with each color signifying a different form. The presence of various colors indicates the presence of different types of forms.
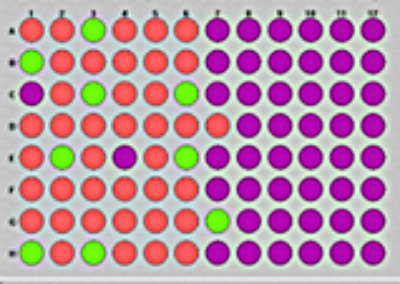
Figure 5. Well plates are color-coded after analysis. Image Credit: Thermo Fisher Scientific – Materials & Structural Analysis
In this specific instance, three distinct colors are visible: orange and green signify the presence of one or the other polymorph type, while purple indicates empty well plate positions.
This type of analysis is a non-supervisory approach and swiftly identifies the sample types in different wells using a color-coded map of the well plates. A comprehensive report is also available for all the wells, providing well positions and corresponding results based on the chosen method.
Source: Thermo Fisher Scientific – Materials & Structural Analysis
Title: WP1
Data file: C:\my documents\omnic\Array\WP1.srs
Sequence file: C:\my documents\omnic\VRParam\MicroTiter.ary
Comment:
Method: Cluster analysis Region: 904.9 - 82.6
Similarity: 70.0 |
| |
| Well |
Mode |
X Pos |
Y Pos |
Z Pos |
Cluster |
| A1 |
Center |
-3 |
5 |
9220 |
2 |
| A2 |
Center |
5 |
5 |
9220 |
2 |
| A3 |
Center |
2 |
5 |
9220 |
1 |
| A4 |
Center |
0 |
5 |
9220 |
2 |
| A5 |
Center |
-3 |
5 |
9220 |
2 |
| A6 |
Center |
-5 |
5 |
9220 |
2 |
Workflow Steps
1. Load the plate on the DXR3 SmartRaman Spectrometer plate holder.
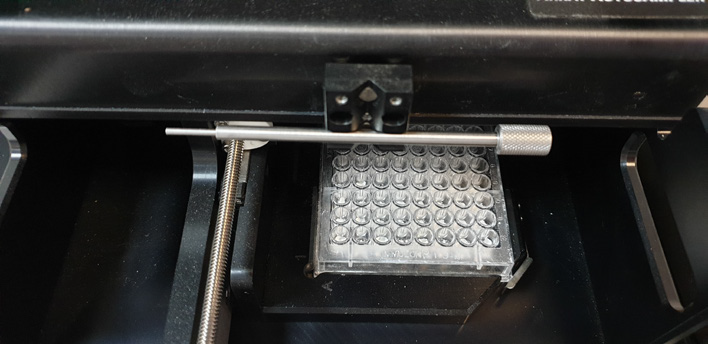
Image Credit: Thermo Fisher Scientific – Materials & Structural Analysis
2. Select the predefined template.
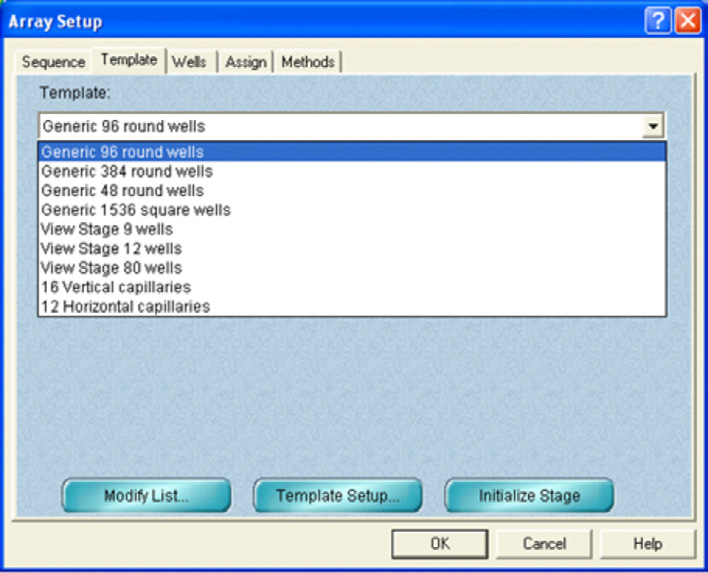
Image Credit: Thermo Fisher Scientific – Materials & Structural Analysis
3. Specify which wells to sample and how.
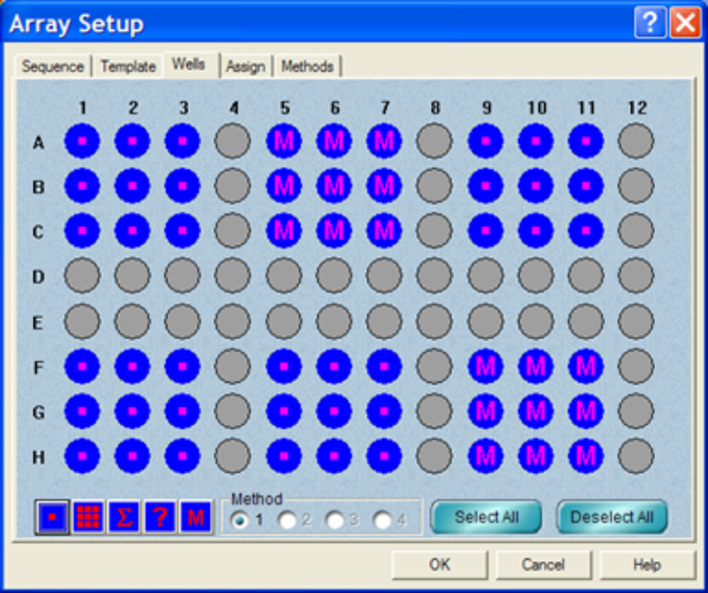
Image Credit: Thermo Fisher Scientific – Materials & Structural Analysis
4. Set Data Collection parameters with a live spectrum view for the ease of Optimization.
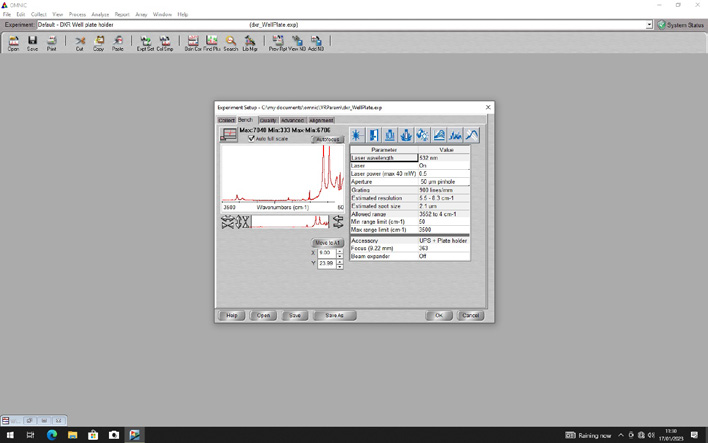
Image Credit: Thermo Fisher Scientific – Materials & Structural Analysis
5. Collect data for specified wells on the well plate.
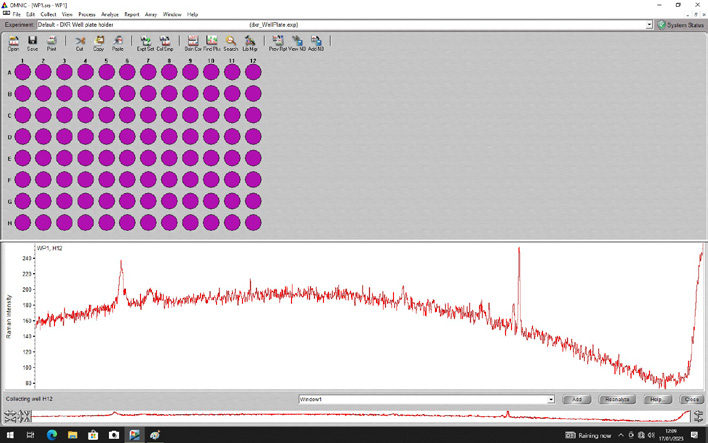
Image Credit: Thermo Fisher Scientific – Materials & Structural Analysis
6. Apply analysis (Automated).
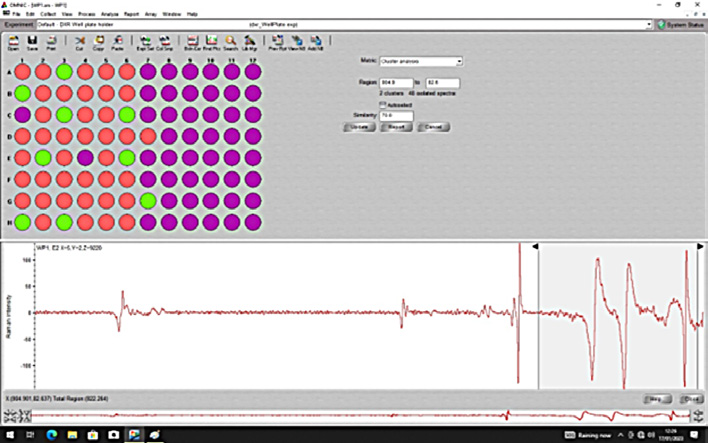
Image Credit: Thermo Fisher Scientific – Materials & Structural Analysis
7. Extract data.
8. Report.
Source: Thermo Fisher Scientific – Materials & Structural Analysis
Title: WP1
Data file: C:\my documents\omnic\Array\WP1.srs
Sequence file: C:\my documents\omnic\VRParam\MicroTiter.ary
Comment:
Method: Cluster analysis Region: 904.9 - 82.6
Similarity: 70.0 |
| |
| Well |
Mode |
X Pos |
Y Pos |
Z Pos |
Cluster |
| A1 |
Center |
-3 |
5 |
9220 |
2 |
| A2 |
Center |
5 |
5 |
9220 |
2 |
| A3 |
Center |
2 |
5 |
9220 |
1 |
| A4 |
Center |
0 |
5 |
9220 |
2 |
| A5 |
Center |
-3 |
5 |
9220 |
2 |
| A6 |
Center |
-5 |
5 |
9220 |
2 |
| A7 |
Center |
3 |
5 |
9220 |
|
| |
| Well |
Mode |
X Pos |
Y Pos |
Z Pos |
Cluster |
| B1 |
Center |
-3 |
2 |
9220 |
1 |
| B2 |
Center |
5 |
2 |
9220 |
2 |
| B3 |
Center |
2 |
2 |
9220 |
2 |
| B4 |
Center |
0 |
2 |
9220 |
2 |
| B5 |
Center |
-3 |
2 |
9220 |
2 |
| B6 |
Center |
-5 |
2 |
9220 |
2 |
| B7 |
Center |
3 |
2 |
9220 |
|
| |
| Well |
Mode |
X Pos |
Y Pos |
Z Pos |
Cluster |
| C1 |
Center |
-3 |
-1 |
9220 |
|
| C2 |
Center |
5 |
-1 |
9220 |
2 |
| C3 |
Center |
2 |
-1 |
9220 |
1 |
| C4 |
Center |
0 |
-1 |
9220 |
2 |
| C5 |
Center |
-3 |
-1 |
9220 |
2 |
| C6 |
Center |
-5 |
-1 |
9220 |
1 |
| C7 |
Center |
3 |
-1 |
9220 |
|
| |
| Well |
Mode |
X Pos |
Y Pos |
Z Pos |
Cluster |
| D1 |
Center |
-3 |
-5 |
9220 |
2 |
| D2 |
Center |
5 |
-5 |
9220 |
2 |
| D3 |
Center |
2 |
-5 |
9220 |
2 |
| D4 |
Center |
0 |
-5 |
9220 |
2 |
| D5 |
Center |
-3 |
-5 |
9220 |
2 |
| D6 |
Center |
-5 |
-5 |
9220 |
2 |
| D7 |
Center |
3 |
-5 |
9220 |
2 |
| |
| Well |
Mode |
X Pos |
Y Pos |
Z Pos |
Cluster |
| E1 |
Center |
-3 |
2 |
9220 |
2 |
| E2 |
Center |
5 |
2 |
9220 |
1 |
| E3 |
Center |
2 |
2 |
9220 |
2 |
| E4 |
Center |
0 |
2 |
9220 |
|
| E5 |
Center |
-3 |
2 |
9220 |
2 |
| E6 |
Center |
-5 |
2 |
9220 |
1 |
| E7 |
Center |
3 |
2 |
9220 |
|
| |
| Well |
Mode |
X Pos |
Y Pos |
Z Pos |
Cluster |
| F1 |
Center |
-3 |
0 |
9220 |
2 |
| F2 |
Center |
5 |
0 |
9220 |
2 |
| F3 |
Center |
2 |
0 |
9220 |
2 |
| F4 |
Center |
0 |
0 |
9220 |
2 |
| F5 |
Center |
-3 |
0 |
9220 |
2 |
| F6 |
Center |
-5 |
0 |
9220 |
2 |
| F7 |
Center |
3 |
0 |
9220 |
|
| |
| Well |
Mode |
X Pos |
Y Pos |
Z Pos |
Cluster |
| G1 |
Center |
-3 |
-4 |
9220 |
2 |
| G2 |
Center |
5 |
-4 |
9220 |
2 |
| G3 |
Center |
2 |
-4 |
9220 |
2 |
| G4 |
Center |
0 |
-4 |
9220 |
2 |
| G5 |
Center |
-3 |
-4 |
9220 |
2 |
| G6 |
Center |
-5 |
-4 |
9220 |
2 |
| G7 |
Center |
3 |
-4 |
9220 |
1 |
| |
| Well |
Mode |
X Pos |
Y Pos |
Z Pos |
Cluster |
| H1 |
Center |
-3 |
3 |
9220 |
1 |
| H2 |
Center |
5 |
3 |
9220 |
2 |
| H3 |
Center |
2 |
3 |
9220 |
1 |
| H4 |
Center |
0 |
3 |
9220 |
2 |
| H5 |
Center |
-3 |
3 |
9220 |
2 |
| H6 |
Center |
-5 |
3 |
9220 |
2 |
| H7 |
Center |
3 |
3 |
9220 |
|

This information has been sourced, reviewed and adapted from materials provided by Thermo Fisher Scientific – Materials & Structural Analysis.
For more information on this source, please visit Thermo Fisher Scientific – Materials & Structural Analysis.