Material identification and analysis are crucially important within the forensic analysis field. Similarly to how there is no pre-determined set of materials that comprises all forensic lab analytes, no single technique is always utilized for the identification and examination of samples.
However, irrespective of sample form, Raman spectroscopy offers useful information concerning the molecular structure of various materials, such as paints, powders, makeup, and fabric.1,2
To further increase the Raman spectroscopy’s range of analytical abilities, the Thermo Scientific™ DXR3 Flex Raman Spectrometer provides many sampling modes to capture rapid, high-quality data on any quantity of samples.
This includes a bulk material “macro” sampler, a single-point microscope accessory with fiber optic probes, and a manual stage. The three sampling modes provide benefits depending on the samples' form, size, and shape, but when used in combination, they provide a comprehensive range of sampling capabilities.
To construct a representative image of the utilization of distinct sampling modes on various sample types, a selection of various sample materials of interest was analyzed. The samples and their analysis goals include:
- The quantification of the distribution of mixed powder samples
- The identification of distinct brands of duct tape
- The identification of distinct brands and shades of lipstick, especially in situ on a cup3
- The identification of powdered particulate dissolved in alcohol
The following table presents an overview of the samples tested with each sampling mode. A check mark denotes a suitable analysis method for the given material.
Table 1. Source: Thermo Fisher Scientific – Chemical Analysis
| Sample Type |
Micro Stage Sampler |
Macro Sampler |
Fiber Probe |
| Mixed Powders |
✓ |
✓ |
✓ |
| Lipstick in situ |
* |
* |
✓ |
| Particulate Dissolved in Alcohol |
|
✓ |
✓ |
| Duct Tape |
✓ |
✓ |
✓ |
*A good Raman signal can be achieved with the technique but doing so requires an extra step of sample preparation, involving removing a small sample of the lipstick.
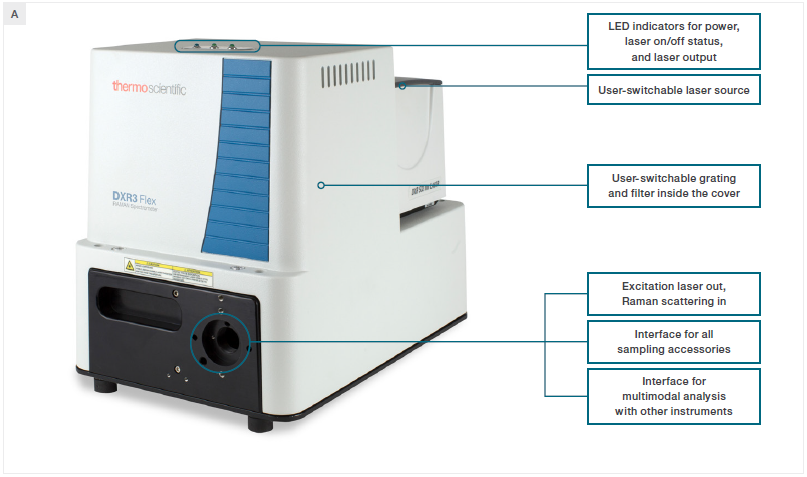
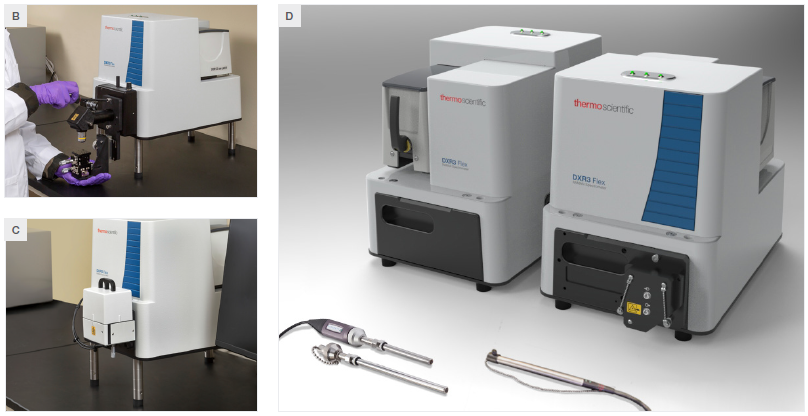
Figure 1. A) A view of the DXR3 Flex Raman Spectrometer with labelled features. B) The microscope sampling accessory. C) The macro sampling accessory. D) The fiber probe sampling accessory. Image Credit: Thermo Fisher Scientific – Chemical Analysis
Quantification of Mixed Powders
These samples are representative of the broader forensic demand for the identification of unknown drugs and to identify and quantify cutting agents. Specific peaks in the Raman signal of a mixed powder can be utilized to identify components within the mixture positively.
Various ratios (by volume) of corn starch and acetaminophen are displayed in Figure 2, alongside spectra of pure corn starch and acetaminophen for reference.
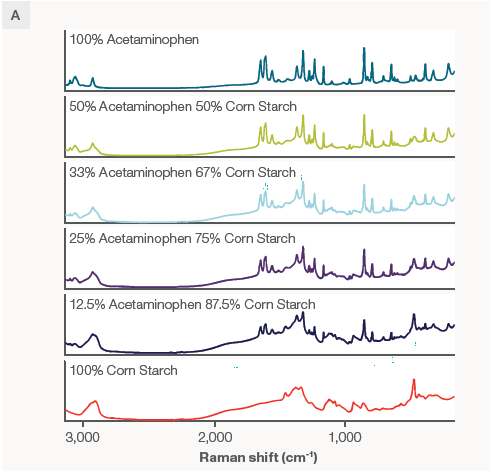
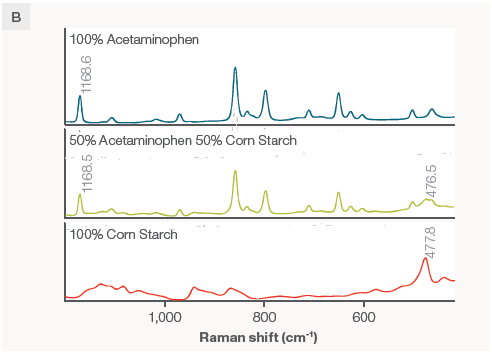
Figure 2. A) Spectra of various acetaminophen/corn starch mixtures. Spectra were collected using a 785 nm laser and the macro sampler with powders in a glass vial. Each spectrum is the average of 4 collections to ensure representative sampling and an excellent signal to noise ratio, taking about 4 minutes per scan. B) The peaks of interest used to build the calibration. Image Credit: Thermo Fisher Scientific – Chemical Analysis
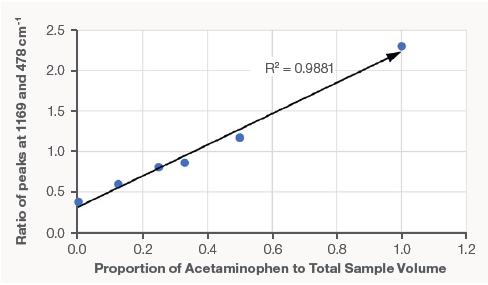
Figure 3. A calibration plotting the volume percentage of acetaminophen to the peak intensity ratio of the 1169 acetaminophen peak and 478 corn starch peak. The result is highly linear with an R² value of 0.9881. Image Credit: Thermo Fisher Scientific – Chemical Analysis
This calibration curve can subsequently be utilized for the quantification of the ratio of acetaminophen to corn starch from any powder mix based on the Raman spectrum.
The high R² value of the linear fit suggests a very strong correlation in the samples. All three modes work well with these samples, however, the macro sampler has the greatest spatial averaging, making it well-suited for bulk and averaged sampling.
Identification of Lipstick in situ
Raman spectroscopy is advantageous compared to many other methods because of its non-destructive nature and minimal sample preparation requirements.
To further leverage this, fiber optic probes enable the sampling of large objects that cannot easily be analyzed using traditional modes. The identification of lipstick brands left on the surface of a cup are representative of this.
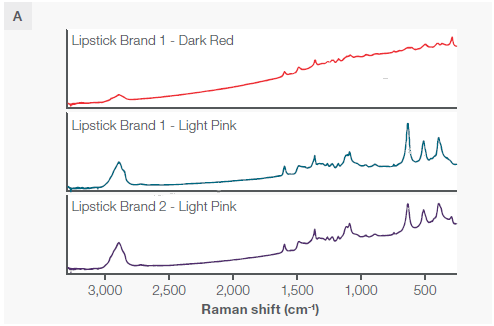
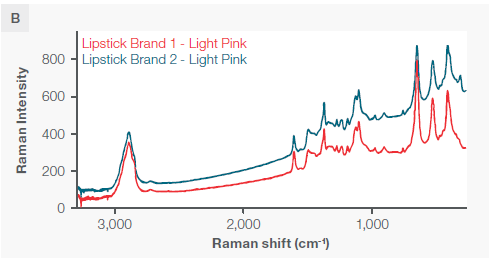
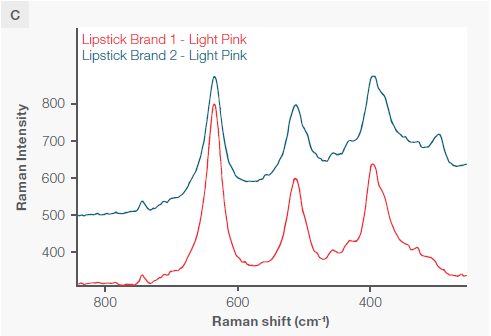
Figure 4. A) Three distinct lipsticks, two of the same brand and two of different brands but the same shade. B) The two matching shades displayed on the same y axis scale. C) A zoomed-in view showing the spectral differences if the main peaks. All spectra were collected with a 785 nm excitation laser and fiber probe accessory. Each spectra had the background Raman spectrum of the cup subtracted. Image Credit: Thermo Fisher Scientific – Chemical Analysis
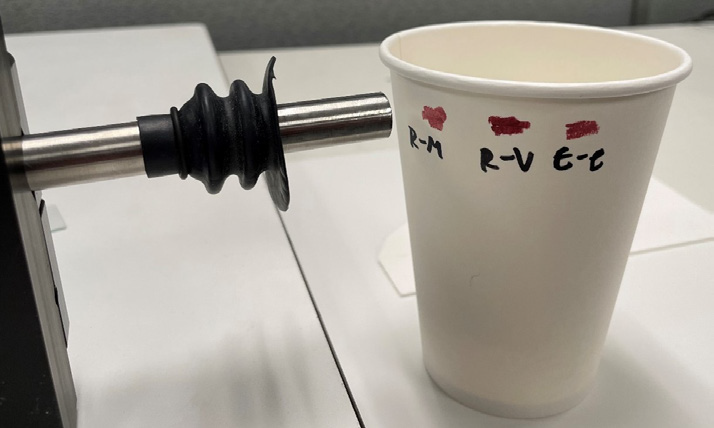
Figure 5. An in situ measurement of lipstick on a cup through the fiber probe accessory. Image Credit: Thermo Fisher Scientific – Chemical Analysis
Despite the two identical lipstick shades from different brands exhibiting nearly identical peak positions (except for the peak at 300 wavenumbers), they have distinct and measurable peak ratios, particularly in the three large peaks at 396, 514, and 637 wavenumbers, as well as a unique peak at 297 wavenumbers.
All three sampling modes can differentiate between the three sampled lipsticks. However, the fiber probe facilitates non-destructive in situ measurements on materials that do not easily fit under a microscope or on the macro sampler—in this case with measurements taken directly on a cup.
Identification of Additives in Drinks
Raman spectroscopy enables the identification of common forensic liquids (including alcohols) as well as trace additives in those liquids, which enables the identification of “spiked” drinks.
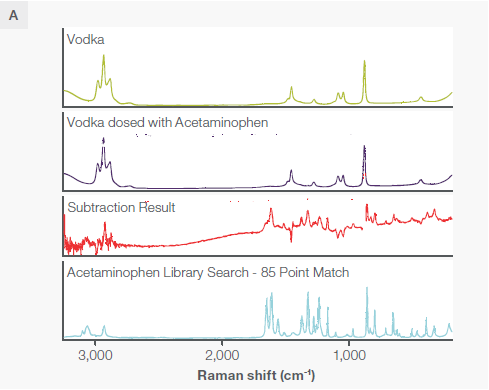
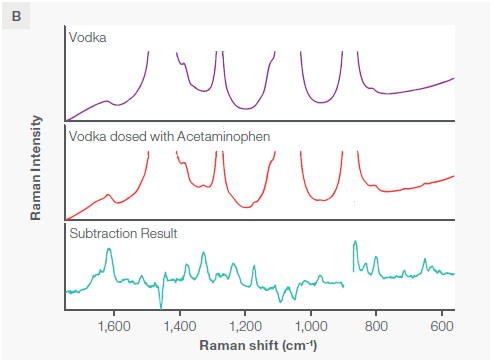
Figure 6. A) A comparison of unadulterated vodka and vodka adulterated with acetaminophen. Although there is no obvious difference between the Raman spectra of two, a subtraction of the two reveals underlying and identifiable acetaminophen peaks, matched with a library spectrum of acetaminophen. B) A slight rescaling of the y axis reveals the presence of these peaks, readily visible in the rescaling at 650, 712, 967, 173, 1327, and 1618 wavenumbers. All spectra were collected with the macro sampling accessory at 785 nm. Note that the blank in the “Subtraction Result” spectrum is the location of a negative peak omitted to optimize the field of view. Image Credit: Thermo Fisher Scientific – Chemical Analysis
Liquid samples (in glass containers for these measurements) respond extremely well to the bulk sampling methods of the macro sampling and fiber probe accessories.
Trace liquids may be measured as individual drops under a microscope, but the small volume may impact the overall Raman signal, particularly when attempting to identify a small amount of additive.
Identification of Brands of Duct Tape
The identification of specific material is highly important, particularly if it can differentiate between different brands of the same material. Different brands of duct tape were sampled on the outside, waterproofed surface.
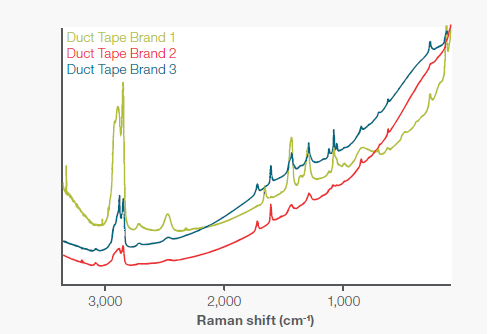
Figure 7. Spectra for three different brands of duct tape. All three spectra were collected with a 785 nm laser and the microscope stage accessory to provide accurate spatial sampling. Brands 2 and 3 have matching peak locations but very discernable peak height ratios unique to their molecular structures. Image Credit: Thermo Fisher Scientific – Chemical Analysis
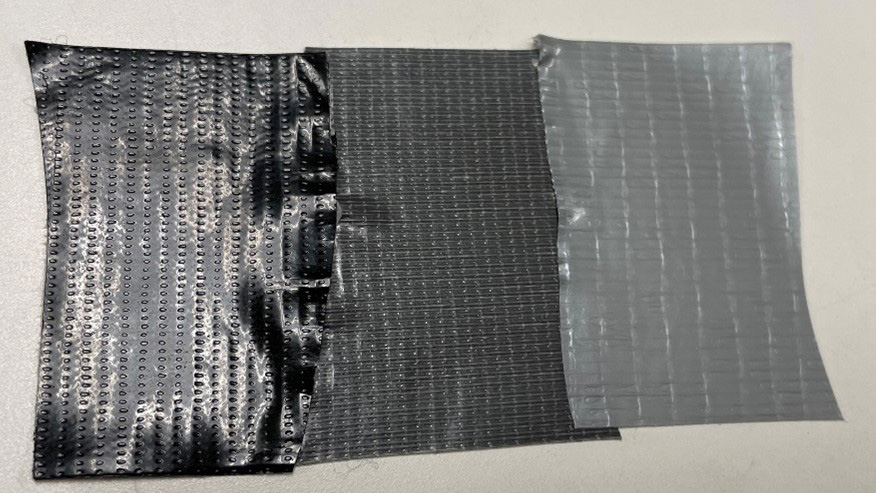
Figure 8. Shown here are the three sampled duct tapes with different coloration. From left to right: Brand 1 is described as an adhesive with waterproof coating, Brand 2 is a rubber-based adhesive with all-weather shell, and Brand 3 is a rubber adhesive with waterproof backing. Image Credit: Thermo Fisher Scientific – Chemical Analysis
Almost all duct tapes are available in several colors and have indistinguishable surfaces. This makes the chemical identification of distinct structures in the formulation of each brand crucial to forensic identification.
All three Raman sampling modes can differentiate between the brands of duct tape, with the best fit being dependent on the shape and size of the sample undergoing analysis.
For example, trace tape fibers are best analyzed under the microscope accessory, while the analysis of tape residue works best with the free motion capabilities of the fiber probe.
Conclusion
The DXR3 Flex Raman Spectrometer can analyze numerous types of potential forensic samples due to multiple sampling accessories which can be changed by the user within minutes.
Although the spectra collected in this study utilized a 785 nm excitation wavelength to address the inherent fluorescence of some samples, the spectrometer is compatible with four different excitation laser wavelengths, namely 455, 532, 633 and 785 nm.
Shorter wavelengths lead to greater Raman intensity for samples that have lower signal-to-noise ratios and lasers can easily be swapped by the user (within minutes) in the system.
With its compact footprint, the DXR3 Flex Raman Spectrometer is an ideal research-grade instrument to transport between laboratory spaces, enabling easy interfacing between Raman spectroscopy and other analytic forensic methods.
References and Further Reading
- https://doi.org/10.1016/j.trac.2017.12.003
- https://doi.org/10.1016/j.forsciint.2010.11.012
- https://doi.org/10.1016/j.forsciint.2013.07.007

This information has been sourced, reviewed and adapted from materials provided by Thermo Fisher Scientific – Chemical Analysis.
For more information on this source, please visit Thermo Fisher Scientific – Chemical Analysis.