Size-exclusion chromatography (SEC) is an analytical technique widely used to analyze factors such as the molecular weight, aggregation, and recovery of proteins. The combination of a light scattering detector and a concentration detector (UV or refractive index, RI) with SEC enables molecular weight measurement of proteins independent of retention time. This is really useful because there is no globular structure for most proteins, which can lead to inaccurate molecular weight measurements.
Instrumentation
The inclusion of more detectors such as dynamic light scattering (DLS), intrinsic viscosity (IV), and a second concentration detector can help acquire more data from a single SEC measurement. One such instrument shown in Figure 1 is the Malvern Panalytical SEC-MALS 20, a 20 angle light scattering device that can make molecular weight measurements of proteins regardless of elution volume.
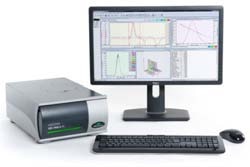
Figure 1. The Viscotek SEC-MALS 20 system.
Experimental Procedure
In this analysis, SEC was used to separate a number of proteins, followed by the molecular weight measurement by conventional calibration and multi angle light scattering (MALS) and the comparison of the results obtained. A TDA RI detector was used to connect the SEC-MALS 20 system to a Viscotek TDAmax system for concentration measurement. Phosphate-buffered saline was used as the mobile phase to separate samples along 2 x Viscotek protein columns by dissolving all of the protein samples in the mobile phase.
Bovine serum albumin, a protein with a well-defined molecular weight, was used to calibrate the SEC-MALS 20 system. Column calibration was carried out with a chain of globular proteins (Gel Filtration Markers Kit for Protein Molecular weights 29,000-700,000 Da, Sigma-Aldrich). The columns and detectors were maintained at 30 °C to achieve effective separation and optimized baseline stability of the detectors.
Experimental Results
Checking the calibration is always good for system verification and the BSA dimer that is often found in BSA samples is an outstanding verification standard. In this analysis, the molecular weight of the dimer was accurately measured, and even that of the trimer was also measured at a high degree of precision.
The BSA chromatogram is shown in Figure 2, and the BSA measurement results are listed in Table 1. The chromatogram of SEC-MALS 20 detector signals for BSA is depicted in Figure 3.
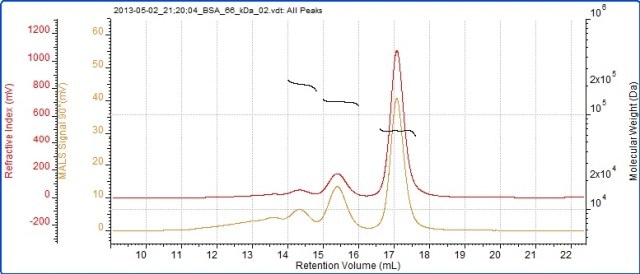
Figure 2. Chromatogram of BSA showing RI (red) and SEC-MALS (90°) (orange) detector signals.
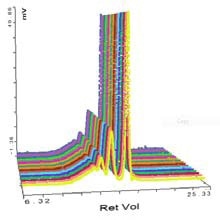
Figure 3. Chromatogram of SEC-MALS 20 detector signals for BSA.
Table 1. Measured molecular weights for BSA monomer, dimer and trimer.
|
|
Trimer |
Dimer |
Monomer |
| Peak RV - (ml) |
14.31 |
15.37 |
17.05 |
| Mn - (kDa) |
203.8 |
135.2 |
66.4 |
| Mw - (kDa) |
204.4 |
135.3 |
66.5 |
| Mw / Mn |
1.003 |
1.001 |
1.001 |
| Wt Fr (Peak) |
0.054 |
0.165 |
0.78 |
The detector responses and peak sizes are the same for an isotropic scatterer at each angle. The molecular weights are seen to be very stable across all of these peaks, indicating that they are monodisperse. This and the molecular weight values suggest that these peaks are different BSA oligomers.
The data acquired from the conventional calibration is shown in Figure 4. The refractive index signal for carbonic anhydrase is depicted in the chromatogram. Conventional calibration was used to measure the molecular weights of the BSA dimer and trimer, and the corresponding results are listed in Table 2. The Table 2 data can be compared with the SEC-MALS data in Table 1.
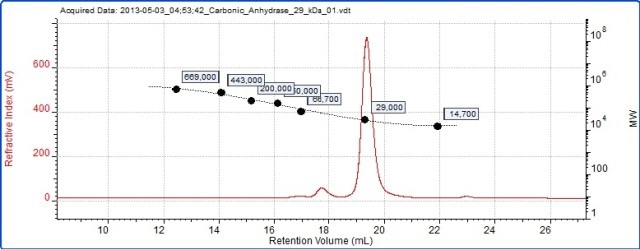
Figure 4. Chromatogram of carbonic anhydrase overlaid with the column calibration curve.
Table 2. Molecular weights of BSA oligomer peaks as measured by column calibration.
|
|
Trimer |
Dimer |
| Peak RV-(ml) |
14.32 |
15.33 |
| Mn - (kDa) |
341.1 |
198.4 |
| Mw - (kDa) |
345.1 |
202.2 |
| Mw / Mn |
1.012 |
1.019 |
| Wt Fr (Peak) |
0.021 |
0.103 |
Accurate molecular weight measurement of oligomers is not possible with column calibration because these oligomers’ structure is no longer as globular as the monomer. Moreover, the accuracy of the molecular weight measurement by column calibration cannot be crosschecked due to the lack of light scattering. Hence, these peaks could erroneously be classified as trimer and pentamer.
However, the light scattering results shown in Table 1 help identifying the dimer and trimer correctly through accurate measurement of their molecular weights. Finally, the molecular weight of pepsin was measured by column calibration and SEC-MALS. Figure 5 shows the chromatogram and light scattering results and Table 3 provides a comparison of the calculated molecular weights.
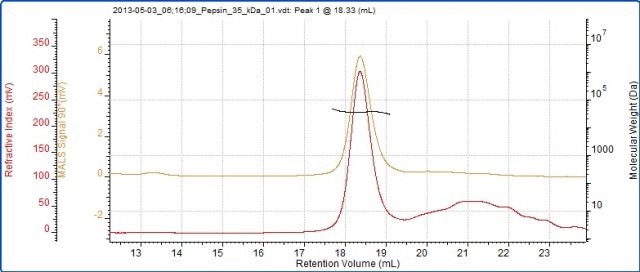
Figure 5. Chromatogram of pepsin showing RI (red) and SEC-MALS (90°) (orange) detector signals.
Table 3. Molecular weight of pepsin measured by conventional calibration and by light scattering.
|
|
MALS |
Column calibration |
| Peak RV - (ml) |
18.33 |
18.63 |
| Mn - (kDa) |
34.6 |
38.S |
| Mw - (kDa) |
34.7 |
39.6 |
| Mw / Mn |
1.004 |
1.028 |
SEC-MALS correctly measured the molecular weight of pepsin at 35 kDa, but column calibration erroneously measured the protein’s molecular weight at 40 kDa. This erroneous measurement by column calibration was due to the non-globular structure of pepsin, assuming larger value than it would be for a globular protein. Conversely, light scattering provides accurate molecular weight measurement as it is independent of retention volume.
Conclusion
The results clearly demonstrate the ability of the Malvern Panalytical SEC-MALS 20 system to provide accurate molecular weight measurements for a number of proteins.

This information has been sourced, reviewed and adapted from materials provided by Malvern Panalytical.
For more information on this source, please visit Malvern Panalytical.