The physical properties and behaviours of polymers are based strongly on the properties of the polymer molecules themselves. The behaviour of the material is influenced by the molecular size and structure, molecular weight, and the molecular weight distribution. The most commonly used tool for assessing these parameters is gel permeation chromatography, also known as size exclusion chromatography.
The GPC principle involves separation of the sample as it travels through an inert but porous column matrix. While smaller molecules deeply penetrate the pores, larger molecules are excluded and thus travel through the column faster. A separation based on the hydrodynamic value is the result but the desire is to know the sample’s molecular weight.
The Viscotek SEC-MALS 20
The Malvern Panalytical SEC-MALS 20 system is a 20° angle light scattering detector that can determine the molecular weight and Rg (radius of gyration). It is used as part of a multi-detector GPC system that combines light scattering with other detectors such as refractive index (RI), ultraviolet (UV) and intrinsic viscosity (IV) to obtain significant amount of information about a sample simultaneously.
The molecular weight, molecular weight distribution and size of two common polymers are measured using SEC-MALS in this article. The results from SEC-MALS are compared with those from conventional calibration and the differences are discussed.
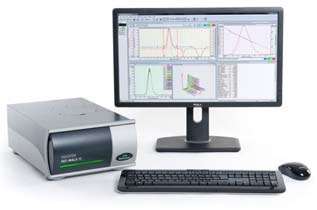
Figure 1. The Viscotek SEC-MALS 20 Mastersizer application note - MRK1921-01 2.
Materials and Methods
The SEC-MALS 20 system is connected to a Viscotek GPCmax and a Viscotek VE3580 RI detector. Separation of the samples is done with the help of two Viscotek T6000M columns. The mobile phase was THF stabilized with 300 ppm BHT. Samples were permitted to dissolve overnight to ensure complete dissolution. The calibration of the SEC-MALS system was done with a traceable 105 kDa polystyrene standard. The traditional calibration setup was calibrated with a series of polystyrene standards of known molecular weights.
In order to ensure good separation and increase baseline stability, the columns and detectors were all held at 35°C. The two samples studied in this note are a broad distribution polystyrene sample with a molecular weight of 235 kDa (2.35 x 10⁵ g/mol) and a broad distribution polymethylmethacrylate (PMMA) sample. Both of these were dissolved in the mobile phase and run through the system. Using bothe traditional calibration and the SEC-MALS 20, the molecular weights were determined.
Results
Figure 2A shows a chromatogram of the 235 kDa polystyrene sample with high polydispersity is shown in figure 2A. The inset table shows the measured molecular weight. The Viscotek SEC-MALS 20 determines light scattering intensity at 20 angles and the full angular data is shown in figure 2B. The molecular weight and Rg distributions are shown in Figure 2C. Rg has been measured across around three quarters of the peak, corresponding to the area where the molecules are large enough to scatter light anisotropically and therefore have Rg measured, and this is plotted in the maroon line.
Figure 2D shows a Debye plot showing the angular dependence of the scattered light. The molecule size is small enough at a retention volume of around 18 ml that they are isotropic scatterers meaning they scatter light evenly in all directions. Figure 2E shows an example of a Debye plot from this region. The slope the line is virtually zero and an Rg cannot be measured. Hence the Rg distribution ends at approximately 10 nm, which is the lower Rg limit for SEC-MALS, and is extrapolated from this point forwards.
In the past, measurements of molecular weight using GPC were made using a traditional calibration curve made of a series of standards of known molecular weight. For this work, a calibration curve was created using a series of polystyrene standards.
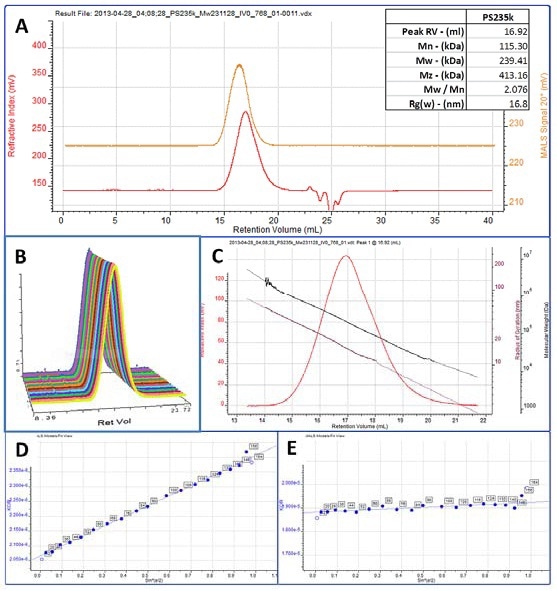
Figure 2. A. Chromatogram of PS235k showing the RI (red) and MALS 90° (orange) detector signals.
B. Chromatogram showing the PS235k peak in the 20 angles of the Viscotek SEC-MALS 20.
C. RI chromatogram of the PS235k sample overlaid with the molecular weight (black) and Rg (maroon) distributions.
D. Debye plot from an anisotropic region of the peak.
E. Debye plot from an isotropic region of the peak.
Figure 3 shows the curve overlaid on a chromatogram of PS400k, a 4x10⁵ g/mol standard used as part of the calibration curve. A sample of polymethylmethacrylate (PMMA) was dissolved in the mobile phase and separated on the system. Figure 4 shows its chromatogram overlaid with the same polystyrene conventional calibration curve. The molecular weight results are shown in the inset table.
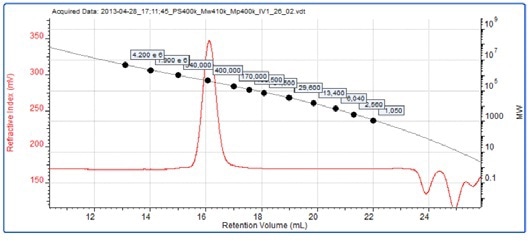
Figure 3. RI chromatogram for the 4 x 10⁵ g/mol polystyrene conventional calibration standard overlaid with a conventional calibration curve.
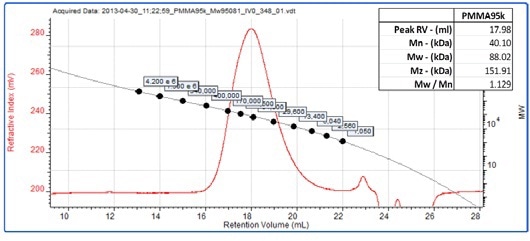
Figure 4. RI chromatogram for the unknown PMMA sample overlaid with a conventional calibration curve.
From low angle light scattering measurements the sample is known to have a molecular weight of 9.5 x 10⁴ g/mol from low-angle light scattering (LALS) measurements. However its measured molecular weight using conventional calibration is approximately 85 kDa and is therefore significantly underreported. This is because the PMMA has a different size/molecular weight relationship to the polystyrene standards used in the calibration, which is to say that it has a different structure.
At different retention volumes, molecules of similar molecular weight therefore will elute. This confirms that if polystyrene is used to create a conventional calibration curve and PMMA is the sample, the measured molecular weight will not be accurate. The molecule’s intrinsic viscosity actually defines this relationship but this parameter is discussed in other application notes (ref MRK 1925). On the other hand, molecular weight measurements by light scattering are independent of the sample retention volume. Hence when this PMMA sample is determined the results need to be more accurate. Measuring the sample using the Viscotek SEC-MALS 20 produced the results shown in figure 5.
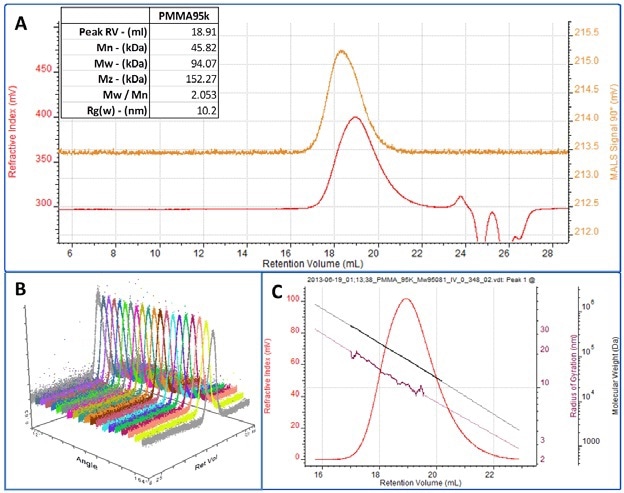
Figure 5. A. RI (red) and MALS 90° (orange) chromatograms for the PMMA sample. Table of molecular weight results shown inset.
B. Multi-angle view showing the response to the sample on all 20 detectors in the Viscotek SEC-MALS 20.
C. RI chromatogram of the PMMA peak overlaid with the measured molecular weight (black) and Rg (maroon).
Figure 5A shows the chromatogram for the PMMA sample including both the RI and the SEC-MALS 90° signals. The inset table shows that the measured molecular weight is 94 kDa, very close to the correct value measured by LALS. Thus the molecular weight is measured by the SEC-MALS with far greater accuracy than by conventional calibration. The measured molecular weight is shown in figure 5C overlaid on the RI chromatogram. As discussed above for the polystyrene sample, using MALS also enables the measurement of Rg for molecules large enough to scatter light anisotropically. Figure 5C shows the measured Rg across most of the peak. The measured average Rg is 10.2 nm. In the descending edge of the peak as the size of the molecules falls below 10 nm, the Rg can no longer be measured as the sample is scattering light isotropically in this region.
Conclusion
By adding a light scattering device as a detector to the GPC system the device is able to precisely measure the molecular weight of any polymer, independently of its elution volume. The Malvern Panalytical SEC-MALS 20 is shown here to successfully measure the molecular weight of both a polystyrene and PMMA sample. The molecular weight of the PMMA measured using SEC-MALS is different from that determined using conventional calibration due to the varying structures of the different polymers. This results in inaccurate measurements of molecular weight when conventional calibration is used but is not a problem for the SEC-MALS 20 which measures the absolute molecular weight independent of sample retention volume.

This information has been sourced, reviewed and adapted from materials provided by Malvern Panalytical.
For more information on this source, please visit Malvern Panalytical.