The observation of static characterization and dynamic response is crucial for testing and designing MEMS devices. They are essential for confirming calculations, establishing cross-talk effects and quantifying the deformation of surfaces.
The MSA-600-X/U Micro System Analyzer offers unique solutions for ultra-high-frequency vibration analysis of micro-acoustic and microstructures devices.
The laser Doppler vibrometer delivers high performance and provides fast and live response measurement with sub-pm displacement resolution.
The built-in stroboscopic video microscope allows streamlined characterization and live animation of in-plane movement. The optional white-light interferometer offers scores of 3D surface data in just seconds. The MSA-600 analyzer—complemented by its intuitive user interface and simple operation—is a robust optical measurement solution in MEMS research and development and quality check.
Highlights
- An all-in-one optical measurement workstation
- Unrivaled sub-pm displacement resolution
- Live response measurements without post-processing up to 2.5 GHz
- Rapid measurement and visualization of deflection shapes
- Intuitive and simple operation
- Automated system for convenient incorporation into probe stations
Technical Data
Table 1. Source: Polytec
| MSA-600-X/ U system configurations |
| Basic configuration |
Out-of-plane vibration measurement up to 300 MHz / 600 MHz |
| Options |
| Bandwidth extension (BWX) 1 |
Out-of-plane vibration measurement up to 1300 MHz / 2500 MHz |
| Differential measurement |
Differential out-of-plane measurement |
| Planar motion analysis 2 |
In-plane-motion analysis |
| Topography measurement |
Topography measurement |
1 suitable for model MSA-600-U
2 suitable for model MSA-600-X
Table 2. Source: Polytec
| Metrological specifications |
| Out-of-plane measurement |
Laser Doppler vibrometry |
| Configuration |
MSA-600-X |
MSA-600-U |
BWX1 |
BWX2 |
|
| Min. frequency |
6.25 Hz |
6.25 Hz |
200 MHz |
1300 MHz |
|
| Max. frequency |
300 MHz |
600 MHz |
1300 MHz |
2500 MHz |
|
| Best Frequency resolution |
| up to 200 MHz |
6.25 Hz |
6.25 Hz |
- |
- |
|
| 500 MHz |
15.625 Hz |
15.625 Hz |
- |
- |
|
| 600 MHz |
- |
31.25 Hz |
- |
- |
|
| 1300 MHz |
- |
- |
62.5 Hz |
- |
|
| 2500 MHz |
- |
- |
- |
125 Hz |
|
| Time Domain Measurement |
| Max. sampling time |
160 ms |
160 ms |
- |
- |
|
| Maximum object velocity |
| up to 300 MHz |
≥150 m/s |
≥150 m/s |
13…19 m/s 1 2 |
- |
|
| 300…600 MHz |
- |
80…150 m/s 1 |
19…38 m/s 1 2 |
- |
|
| 600…1300 MHz |
- |
- |
38…80 m/s 1 2 |
- |
|
| 1300…2500 MHz |
- |
- |
- |
80…150 m/s 1 2 |
|
| Displacement resolution 3 4 |
| up to 1 MHz |
100 fm/√Hz |
100 fm/√Hz |
- |
- |
|
| 1 MHz…f max 5 |
7.5 fm/√Hz |
7.5 fm/√Hz |
12.5 fm/√Hz |
12.5 fm/√Hz |
|
| 1 MHz…f max 6 |
15 fm/√Hz |
15 fm/√Hz |
25 fm/√Hz |
25 fm/√Hz |
|
| 1 MHz…f max 7 |
30 fm/√Hz |
30 fm/√Hz |
50 fm/√Hz |
50 fm/√Hz |
|
1 Frequency dependend
2 Maximum displacement amplitude ≤10 nm
3 The noise-limited resolution is defined as the signal amplitude (rms) at a signal-to-noise ratio of 0 dB and a spectral resolution of 1 Hz.
4 The attainable resolution is frequency-dependent. The specified values are average values across the given bandwidth.
5 MSA-600-X/-U without MSA-A-DIF option
6 With MSA-A-DIF option, non-differential measurement mode
7 With MSA-A-DIF option, differential measurement mode
Table 3. Source: Polytec
| In-plane measurement |
Stroboscopic video microscopy |
| Configuration |
MSA-600-X with planar motion analysis option |
| Frequency range |
1 Hz …2.5 MHz |
| Max. velocity |
>0.1 m/s … 10 m/s (magnification dependent) |
| Objective magnification 2 |
1x … 100x |
| Displacement amplitude resolution 3 |
5 nm |
| Time resolution |
100 ns (strobe exposure time); max. strobe jitter ±40 ns |
| System output |
Displacement data, bode diagram, step-response plots, decay plots, trajectory plots |
1 Averaging is performed over the maximum bandwidth fmax of the respective range.
2 Objective specifications, as specified in table below.
3 Frequency noise floor for 512 shots per frequency on vibration isolated table.
Table 4. Source: Polytec
| Topography measurement |
White-light interferometry |
| Configuration |
MSA-600 with topography measurement option |
| Vertical measurement range |
250 μm |
| Method of evaluation |
smooth surface 1 |
rough surface 2 |
| Z performance: |
| Measurement noise 3 |
0.09 nm |
6 nm |
| Vertical resolution 4 |
<1 nm |
<37 nm |
| Flatness measurement: |
| Average flatness deviation 5 |
4.5 nm |
45 nm |
| Repeatability 6 |
0.25 nm |
14 nm |
| Step Height Measurement on a calibrated Depth Setting Standard 2 7 |
| Nominal step height |
0.24 μm |
0.75 μm |
7.5 μm |
75 μm |
| Repeatability 8 |
0.02 μm |
0.04 μm |
0.05 μm |
0.06 μm |
| Maximum Deviation 9 |
0.05 μm |
0.12 μm |
0.16 μm |
0.18 μm |
1 Analysis of the correlogram phase, can be used on flat surfaces.
2 Analysis of the correlogram envelope, for usage on unsteady/rough surfaces
3 RMS value of the signal amplitude for an averaged measurement on a parallelly aligned plane mirror (R ≈ 4%, λ/20), calculated from 25 single measurements, under repeatability conditions.
4 Measurement noise (N = 1) · √8
5 Mean value of measured flatness values (according to ISO 1101) of 50 measurements on a parallelly aligned plane mirror (R ≈ 4%, λ/20) under repeatability conditions.
6 Standard deviation of the measured flatness values (according to ISO 1101) of 50 measurements on a parallelly aligned plane mirror
(R ≈ 4%, λ/20) under repeatability conditions.
7 15 measurements per step on a calibrated depth setting standard, type KNT 4080/30 (ISO 5436-1)
8 Standard deviation of the measured deviation of the calibrated step height under repeatability conditions.
9 Largest measured deviation in relation to the calibrated step height out of 15 measurements per step under reproducibility conditions.
Table 5. Source: Polytec
| Optical specifications |
| MSA-I-620 Sensor Head |
| Laser wavelength |
532 nm |
| Laser safety class |
class 3R (<5 mW visible output) |
| Light source wavelength |
470 nm |
| Light source safety class |
class 2 LED product (<20 mW visible output) |
| Camera |
Full-field progressive scan camera |
| Camera resolution |
1732 x 1200 pixel |
Table 6. Source: Polytec
Bright field
objectives |
Magnification |
Working distance
(WD) mm |
Spot diameter
(1/e²) μm |
Field of view
mm x mm |
| A-MOB-001X |
1 |
13 |
46 |
10.0 x 7.0 |
| A-MOB-002X |
2 |
34 |
23 |
5.1 x 3.5 |
| A-MOB-005X |
5 |
34 |
9.3 |
2.0 x 1.4 |
| A-MOB-010X |
10 |
33.5 |
4.6 |
1.0 x 0.7 |
| A-MOB-010B-LD |
10 |
48.9 |
4.6 |
1.0 x 0.7 |
| A-MOB-020X |
20 |
20 |
2.3 |
0.51 x 0.35 |
| A-MOB-050X |
50 |
13 |
1.4 |
0.20 x 0.14 |
| A-MOB-100X |
100 |
6 |
0.8 |
0.10 x 0.07 |
Table 7. Source: Polytec
Interference
objectives |
Magnification |
Working distance
(WD) mm |
Type |
Field of view
mm x mm |
| A-IOB-02X5-B |
2.5 |
10.3 |
Michelson |
4.0 x 2.8 |
| A-IOB-005X-B |
5 |
9.3 |
2.0 x 1.4 |
| A-IOB-010X-B |
10 |
7.4 |
Mirau |
1.0 x 0.7 |
| A-IOB-020X-B |
20 |
4.7 |
0.51 x 0.35 |
| A-IOB-050X-B |
50 |
3.4 |
0.20 x 0.14 |
| A-IOB-100X-B |
100 |
2 |
0.10 x 0.07 |
Table 8. Source: Polytec
| General specifications |
| Component |
MSA-I-620
Sensor Head |
MSA-F-620
Front-End |
MSA-W-620 Data
Management
System |
MSA-E-600
Controller |
| Power |
via MSA-F-600
Front End |
100 … 240 VAC
± 10%, 50/60 Hz
max. 100 VA |
100… 240 VAC
± 10%, 50/60 Hz
max. 525 VA |
100… 240 VAC
± 10%, 50/60 Hz
max. 450 VA |
Dimensions
[W x L x H] |
see figure |
485 x 150 x 380 mm
(19", 84 TE/3 HE) |
485 x 190 x 550 mm
(19", 84 TE/4 HE) |
499 x 177 x 373 mm
(19", 98 TE/4 HE) |
| Weight |
12.6 kg |
9.0 kg |
18.0 kg |
12.0 kg |
Operating
temperature |
18 ... 30°C
(64.4 ... 86°F) |
+5…+40°C (41…104°F) |
Storage
temperature |
–10 ... + 65°C
(14 ... 149°F) |
–10 ... + 65°C (14 ... 149°F) |
| Relative humidity |
max. 80%, non-condensing |
Table 9. Source: Polytec
| Compliance with standards |
| Electrical safety |
IEC/EN 61010-1 |
| EMC |
IEC/EN 61326-1 Emission: Limit Class A,
IEC/EN 61000-3-2 and 61000-3-3
Immunity: IEC/EN 61000-4-2 to 61000-4-6 and IEC/EN 61000-4-11 |
| Laser safety |
IEC/EN 60825-1 (CFR 1040.10, CFR 1040.11) |
Expanded uncertainty
of measurement |
SEMI MS4-0416 and MS2-113 |
Software Features
Table 10. Source: Polytec
| Out-of-plane measurement |
| Data acquisition |
| Video display |
Live, full-field, black & white video image of test object directly incorporated into user interface for interactive scan set up and beam positioning. Digital zoom into live video image. |
| Laser positioning |
Visible laser moves with cursor on live video image by clicking or dragging the mouse. |
| Defining scan geometry |
Utilizing APS Professional mode for up to 512 x 512 points per object of any shape. Measurement points are defined graphically over the live video image using a mouse. User can draw individual objects using polar, cartesian or hexagonal grids, or define single points. Define single points (optional): Single point geometry can be optimized by refining or coarsening the grid. Automatic generation of surface elements to connect scan points. |
| Scan geometry import |
Geometry import from UFF or ME’scope format. |
| Autofocus option |
Automatic focusing of the laser at the current position of the specimen or during the scan; allowing for an optimized signal level at every scan position 1. |
Sample
positioning |
Interactive control of X-Y positioning stage (optional) by using the mouse and absolute or relative displacements by precisely defined distances. Measurements at different positions can be acquired separately and combined for analysis and presentation. |
Vibrometer
control |
All vibrometer parameters such as velocity range and tracking filter are software controlled. |
| Display |
Simultaneous display of live video showing actual laser spot, entire scan area including scan points, and multiple analyzer displays of various signals (time traces and spectra). |
Specimen
excitation |
Wide range of waveforms including sine, periodic chirp, white noise, random signals, sweep and arbitrary signals. |
Acquired scan
data |
Entire spectrum acquired for all channels at all scan points |
| FastScan |
Fast acquisition mode (up to 50 points/s) for measurements at a single frequency. Bandwidth is definable. Complex and magnitude averaging and signal enhancement are available. |
Time domain
data (optional) |
Time domain acquisition, time domain averaging, time domain animation. |
| Gate input |
Gate input for intermittent scan control. |
| Scan data validity check |
Data quality check at all scanned points in Signal Enhancement (SE) mode. MSA-600 checks the quality of data in each spectrum. The averaged spectrum is weighted toward those spectra with the best signal to noise ratio. Measured points are labeled: optimal (SE only), valid, or A/D overload. |
| Trigger |
Auto or manual threshold, rising or falling edge, source: external or any measurement signal |
| Averaging |
Complex or magnitude averaging of spectra, peak hold, time |
| FFT lines |
2,343,750; 4,687,500 with BWX 1/2 option |
| Window functions |
Rectangular, Hamming, Hanning, Flat top, Blackman Harris, Bartlett, Exponential |
1 Requires portal stand with automatic z-stage.
Table 11. Source: Polytec
| Data processing and analysis |
| Data organisation |
Support for project oriented workflow by a tree-style file browser for measurements, settings, macros, user defined waveforms, amplitude correction files. Context based actions on different file types. |
| Display |
Color/gray, filled/unfilled contours and 3-D relief maps over stored video image (static or animated), averaged spectra over all scan points, individual spectra at each point as Bode or Nyquist plots, line profiles. Animation of video image for easy visualization of results. Data are scaled in velocity, acceleration or displacement. Logarithmic/linear axes |
| Data transfer |
ASCII, Universal File Format (UFF), ME’scope and PolyWave binary data interface (optional). UFF and ME’scope data can be imported, analyzed and processed as user defined datasets and combined with measured data. |
| Graphics transfer |
Graphic formats AVI (for animations), JPEG, BMP, TIFF, PNG, GIF. |
| Data processing |
Complex spectral analysis provides the following quantities and functions for area and/or single-point data: magnitude, magnitude dB(A), phase, real, imaginary, frequency response function (FRF), H1, H2, auto power, cross power, coherence, averaged RMS over frequency. 3rd octave analysis, ESD, PSD. |
| Polytec Signal Processor |
The Polytec Signal Processor is the user interface to the PolyMath library included in the PSV software. Easy-to-use spreadsheet for post processing of scan data. |
| Automated processing |
Software can be fully automated. |
Table 12. Source: Polytec
| In-plane measurements |
| Data acquisition |
| Working principle |
In the Acquisition Mode, video sequences are sampled and analyzed using proprietary measurement algorithms. |
| Strobe illumination control |
Control of the strobe pulses (interval, pulse length). |
| Data acquisition |
Acquisition of the stroboscopic video image and live view of object movement. |
| Specimen excitation |
Integrated signal generator software for specimen excitation with sine and pulse signals with excitation frequencies up to 2.5 MHz. Support for arbitrary, user-provided excitation signals. |
| Data processing and analysis |
| Working principle |
Motion analysis is performed interactively. Motion data are based on image correlation and displayed as X, Y displacement values. Sub-pixel resolution enables in-plane motion measurements with resolution in the nanometer range. |
| Data organization |
Support for project oriented workflow by a tree-style file browser for measurements and settings. |
| Live video display |
The live video mode provides a steady, slow-motion image sequence of the test object’s motion for visual characterization. |
| Display |
Displacements for individual frequencies and their differentiations as well as frequency spectra, step responses and decay (ring down).
Bode plots for both – horizontal and vertical – motion.
Graphs can be examined using cursors, zoomed and panned. For each graph, different line and marker styles are selectable. |
| Data transfer |
Graphs can be exported as image or ASCII file and sequences of images can be saved as AVI files. |
Table 13. Source: Polytec
| Topography measurements |
| Data acquisition |
| Working principle |
By shifting an interference objective with respect to the sample, a high-resolution X-Y-Z mapping is generated. The interference pattern is captured with the video camera. |
| Measurement modes |
Short coherent measurement
Smart Surface Scanning technique for extended contrast range |
| Data processing and analysis |
| Data organization |
Support for project oriented workflow by a tree-style file browser for measurements and settings. |
| Post-processing |
Envelope or phase evaluation |
| Data evaluation |
Linear regression; polynomial fit; subtracting; averaging; filters like median, erosion, high pass and low pass filter; masking functions |
| Data display |
Surface view: 2D, 3D presentation and isolines view, with video overlay
Profile view: profile sections; correlogram; roughness/waviness parameters; graphs/diagrams, geometrical data like angle, heights, radius etc. |
| Data transfer |
Graphs can be exported in various common image graphic formats; measurement data can be exported as ASCII file. |
| Automated processing |
Software can be fully automated. |
Table 14. Source: Polytec
| Options and accessories |
| Please refer to the document “Accessories for stand-based instruments” |
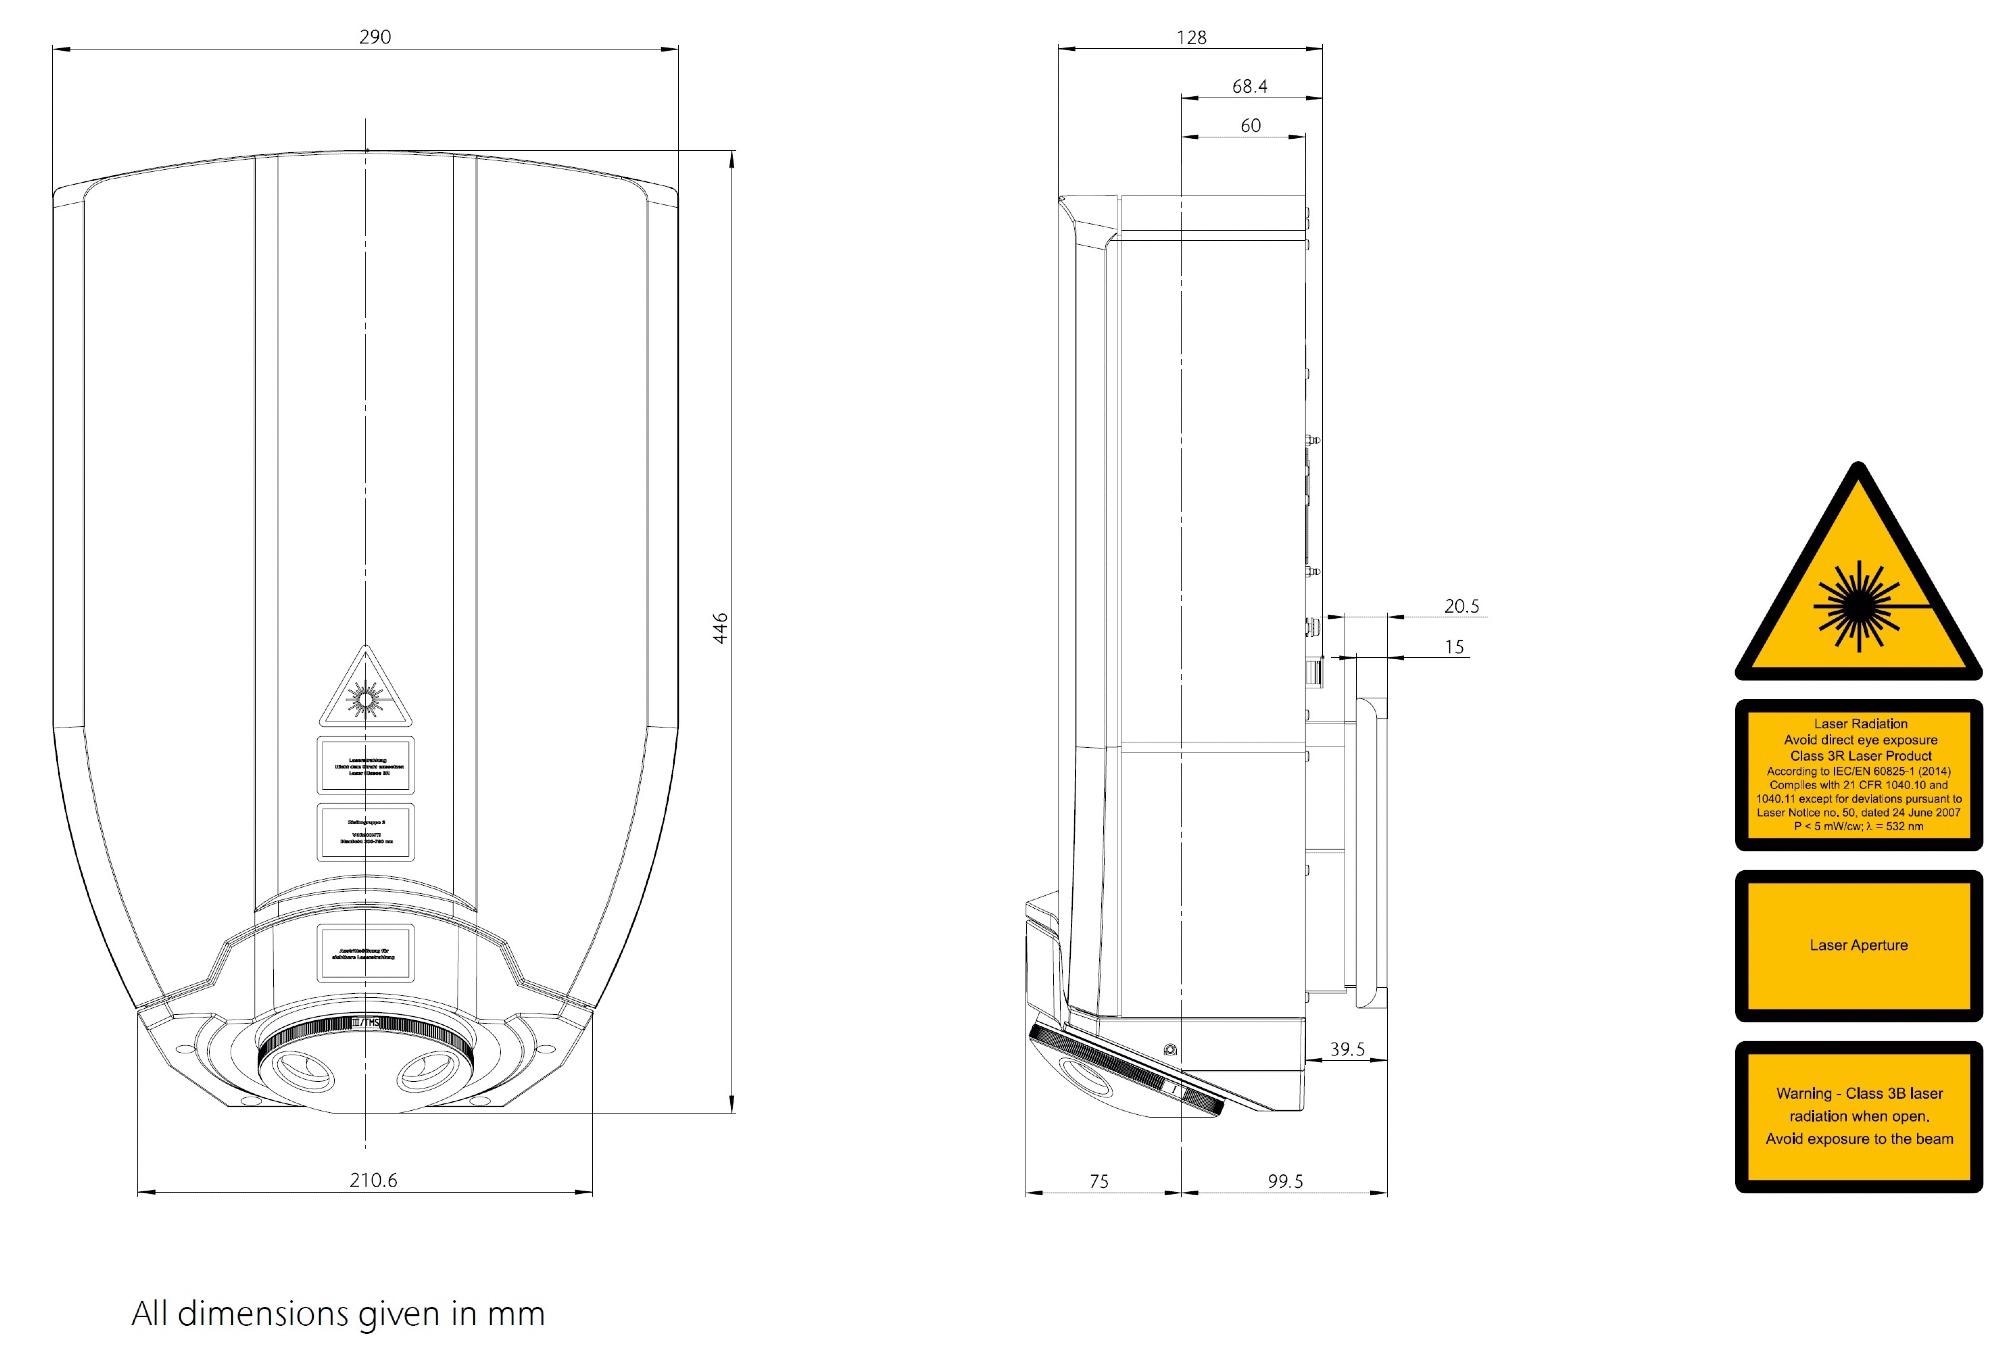
Image Credit: Polytec
Comprehensive Analysis of an MEMS Electrostatic Combdrive
Rapid, live response measurement of the out-of-plane dynamics of the combdrive shows all system resonances. All in-plane modes can be detected with ultra-high sensitivity laser Doppler vibrometry, quantifying their small parasitic out-of-plane contribution.
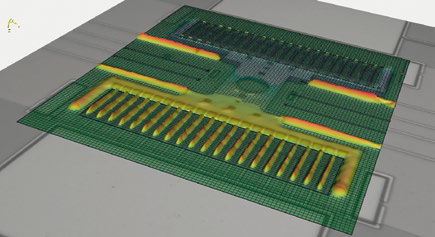
Image Credit: Polytec
The figure below shows a bode plot of the principal in-plane driving mode of the combdrive. The device operation can be observed with real-time mode animation.

Image Credit: Polytec
High-resolution surface topography measurement below shows each detail of the device topography—even as completely automated measurements on wafer-level.
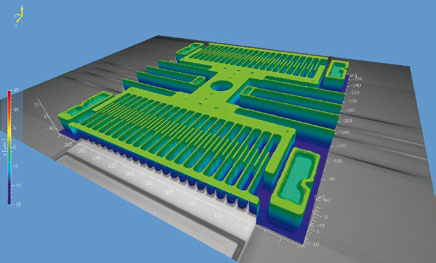
Image Credit: Polytec