Light scattering is a technology that is well-known in the biopharmaceutical industry, regularly used for the screening of biotherapeutic candidates and formulations. The Zetasizer Nano system from Malvern Panalytical integrates all three light scattering technologies including polydispersity trend and interaction parameter from DLS, particle size distribution, electrophoretic mobility and effective charge from ELS and the 2nd virial coefficient from SLS.
This article discusses the development of a bioformulation stability profile, obtained from micro-capillary viscometry and sub-micron light scattering to study the stability of bioformulations.
Biotherapeutic Screening Parameters
One can use analytical instrumentation for both monitoring and predicting sample properties. An instance of monitoring using static light scattering, for instance, will be the determination of molecular weight and degree of conjugation for determining the number of glycosylation sites on a mAb.
Size Distribution
Dynamic light scattering (DLS) is a low resolution technique that requires a 3x difference in size for attaining the baseline resolution in the particle size distribution (PSD). In Figure 1 the DLS size distributions are shown for IgG diluted in two buffers, where RS is the Stokes radius measured in the limit of infinite dilution.
The results observed indicate electrostatic repulsion with the apparent decrease in size being attributable to an electrostatically driven increase in the diffusion coefficient.
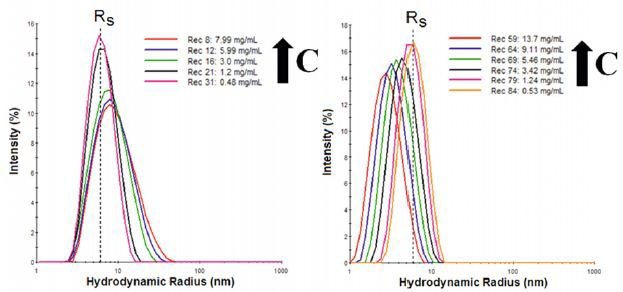
Figure 1. Concentration dependent size distributions for IgG in buffer 1 (left), with Tween stabilizer, and buffer 2 (right) with aspartic acid stabilizer.
Polydispersity Trend
The interpretation of results in Figure 1 can be better understood in the graphical format shown in Figure 2. The figure shows that both the width and the mean size of the IgG oligomeric distribution decrease with decreasing concentration in buffer 1, indicative of reversible self-association.
If there is no temperature increase, electrostatic repulsion is the only force available to increase the diffusion velocity.
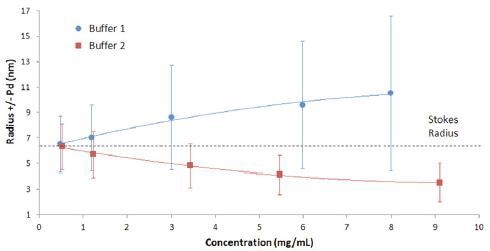
Figure 2. Mean size and polydispersity trend with concentration for IgG in buffer 1 and buffer 2, with the polydispersity represented by error bars.
DLS Interaction Parameter
The qualitative data present in the size distribution and Pd trend can be expressed quantitatively with the DLS interaction parameter (kD). kD is obtained from the slope of the concentration dependence of the mutual diffusion coefficient (D) as shown in Equation 1.
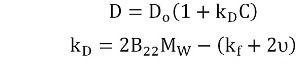
where :
- Do is the self-diffusion coefficient in the limit of zero concentration (C) from which the Stokes radius is derived
- B22 is the 2nd virial coefficient
- MW is the molecular weight
- kf is the 1st order concentration coefficient of the friction coefficient
- υ is the partial specific volume.
Figure 3 shows the concentration dependence of the diffusion coefficient for IgG in buffers 1 and 2.
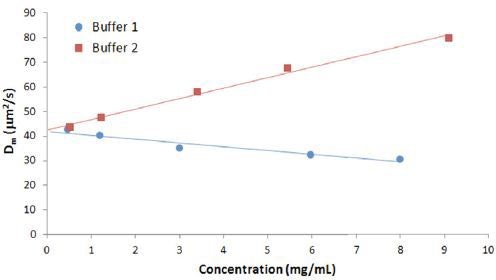
Figure 3. Concentration dependence of the measured diffusion coefficient for IgG in buffers.
Second Virial Coefficient
kD has two components, a thermodynamic component (B22MW) and a hydrodynamic component (kf + υ). B22 is obtained from a Debye plot slope, which represents the concentration dependence of the sample scattering intensity as shown in Equation 2
where
- K is an optical constant
- Rθ is the Rayleigh ratio of scattered to incident light intensity
- MW is the weight average molecular weight
- P(θ) is the shape factor, which is equivalent to 1 for small proteins such as antibodies.
Figure 4 compares the Debye plots for the previous IgG in buffer 1 and 2 example, along with a 3rd buffer using a lactose stabilizer. The Figure shows that buffer 2 and 3 both exhibit positive virial coefficient values, with buffer 1 exhibiting a negative virial coefficient. Based upon empirical predictions, buffer 2 would be expected to be the most stable and buffer 1 the least stable, with buffer 3 somewhere in between.
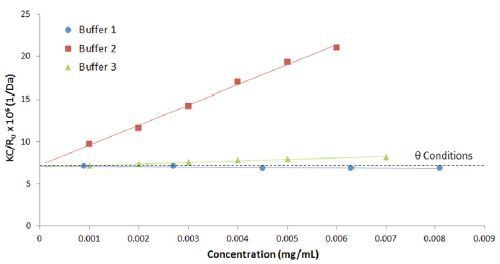
Figure 4. Debye plots for IgG in buffers 1, 2, and 3, with theta conditions at B22 = 0 represented by the dashed line.
Intrinsic Properties
Intrinsic properties may be classed as those properties of the protein within the formulation buffer, but in the absence of concentration dependent effects that impact reported values. The intrinsic properties are explained in more detail in the following section.
Oligomeric Molecular Weight
While conducting an ensemble SLS 2nd virial coefficient measurement, the weight averaged molecular weight (MW) is obtained. In case the monomeric molecular weight is known, comparing with the oligomeric molecular weight can offer an idea of the degree of oligomerization.
Stokes Radius
During the course of an ensemble DLS interaction parameter (kD) measurement, the Stokes radius (RS) is derived. The Stokes radius is an intensity weighted average size of the oligomeric distribution.
Polydispersity
Polydispersity is the third intrinsic property that can be used to provide qualitative information regarding the oligomeric distribution. This value is obtained during the course of a DLS kD measurement (%Pd = Pd/Size).
Net Charge
The net charge (Z) is determined from the electrophoretic mobility (μE), measured using ELS, and the Stokes radius (RS), measured using DLS, as shown in Picture 2
where r is the viscosity, K is the inverse Debye length, f(kRS) is the Henry function, and ZEff is the effective charge at the slipping or interaction plane.
The key driver from the standpoint of colloidal stability is the net charge. Table 1 shows a comparison of the net and effective charges of the previous IgG in buffers 1, 2, and 3 example.
Table 1. Colloidal Stability Predictors
| # |
B22 (mL mol/g2) |
kD (mL/g) |
ZEff |
ZNet |
Colloidal Stability |
| 2 |
127.5 x 10⁻⁵ |
31.9 |
4.3 |
9.1 |
Good |
| 3 |
10.4 x 10⁻⁵ |
-9.7 |
1.6 |
6.3 |
Poor |
| 4 |
2.3 x 10⁻⁵ |
-4.7 |
-0.5 |
-1.1 |
Poor |
| 1 |
-1.5 x 10⁻⁵ |
-5.2 |
0.7 |
3.3 |
Poor |
Melting and Aggregation Temperature
The minimum temperature required to induce aggregation in a protein formulation is the protein aggregation on-set temperature (Tonset). Figure 5 shows the DLS thermal ramps for the previous IgG in buffers 1, 2, 3, and 4 example.
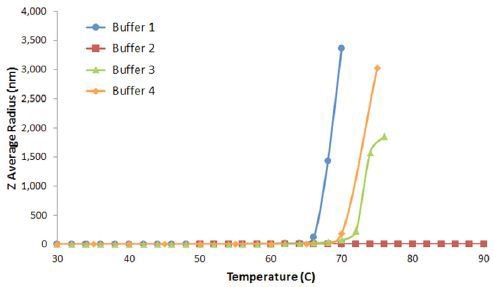
Figure 5. DLS thermal ramps for IgG in buffers 1, 2, 3, and 4, showing the sharp increase in the Z average size at Tonset, indicative of the onset of aggregation.
The temperature at which protein unfolding occurs is the melting temperature (Tm). Figure 6 shows expanded views of the DLS thermal ramps for IgG in buffers 1 and 4, along with the simultaneously measured scattering intensity.
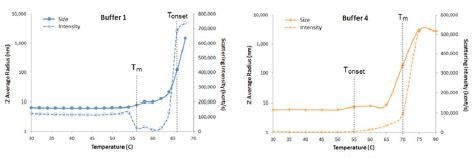
Figure 6. Expanded views of DLS thermal ramps for IgG in buffers 1 and 4, along with the simultaneously measured scattering intensity.
Viscosity
The upper viscosity limits for biotherapeutic manufacturing and subcutaneous injection are normally company dependent, however the ideal values are around 20 and 10 cP for processing and subcutaneous (SubQ) injection respectively.
Figure 7 shows the concentration dependence of the viscosity of IgG in buffer 1 and 2, measured using micro-capillary viscometry. Showing consistency with the light scattering predictors, buffer 2 is the most stable, with SubQ and processing concentration limits of 148 and 176 mg/mL respectively.
In comparison, IgG in buffer 1 exhibits SubQ and processing concentration limits of 137mg/mL and 153mg/mL respectively.
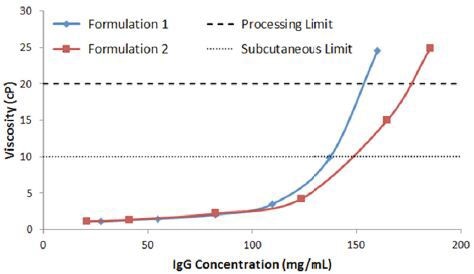
Figure 7. Concentration dependence of viscosity of IgG in buffers 1 and 2, with dashed lines representing the SubQ and processing limits.
The Bioformulation Stability Profile
The stability profile of a biotherapeutic candidate is produced by combining together stability predictors and descriptors that offer insights into the developability and manufacturability of the bioformulation.
The resultant stability profile for the IgG in buffers 1 and 2 example examined in this report is shown in Table 2. The green, yellow, and red coding indicates "go", "caution," and "no go", while "RSA" and "CR" represent reversible self-association and charge repulsion.
Even though specific targets are based on the screening program and the company, the values shown in this example are reasonably representative of typical target values.
Table 2. Bioformulation Stability Profiles -IgG in Buffer 1 and 2.
| |
Target |
Buffer 1
Tween 80 |
Buffer 2
Aspartic Acid |
| PSD |
CR |
RSA |
CR |
| Pd Trend |
⇑ w/ C |
Constant |
| kD (mL/g) |
> 15 |
-5.2 |
31.9 |
| B22 (x 1 05 mL mol/g2) |
> 30 |
-1.5 |
127.5 |
| ZEff |
> 5 |
0.7 |
4.3 |
| Tm (C) |
> 70 |
56 |
-- |
| Tonset(C) |
≥TM |
66 |
> 90 |
| RS (nm) |
5.5 |
5.8 |
5.7 |
| Oligomeric MW (kDa) |
< 150 |
150.2 |
148.6 |
| %Pd (as C⇒0) |
< 20 |
35 |
32 |
| SubQ Limit (mg/mL) |
> 150 |
137 |
148 |
| Processing Limit (mg/mL) |
> 150 |
153 |
176 |
| Relative Stability |
|
Buffer 1 < Buffer 2 |
| Developability |
|
Low |
Moderate |
| Manufacturability |
|
Low |
Moderate |
The parameters in Table 2, although not exhaustive, are obtained from parameters measured using light scattering and viscosity technologies.
These parameters form the initial basis of a predictive stability profile that is readily enhanced by integrating with, or correlating to, additional parameters such as aggregation rates, DSC results, high order structure and other properties relevant to a particular target biotherapeutic formulation profile.

This information has been sourced, reviewed and adapted from materials provided by Malvern Panalytical.
For more information on this source, please visit Malvern Panalytical.